XRP price dropped below $3, raising concerns of a potential crash.
Technical indicators show bearish pressure with a possible short-term drop to $2.07.
NUPL and RSI both suggest growing sell-side momentum.
Despite the pullback, analysts remain bullish on XRP’s long-term trend, forecasting targets above $5, and potentially as high as $27.
The current move is widely viewed as a technical correction, not the start of a prolonged bear market.
Despite bearish short-term indicators, many analysts believe that the long-term outlook for XRP remains bullish. This correction, they argue, is part of a healthy consolidation phase before the next leg up.
At the time of writing, XRP is trading around $2.86, down approximately 5% over the past 24 hours. The inability to maintain support above the psychological $3 level has weakened bullish momentum in the short term.
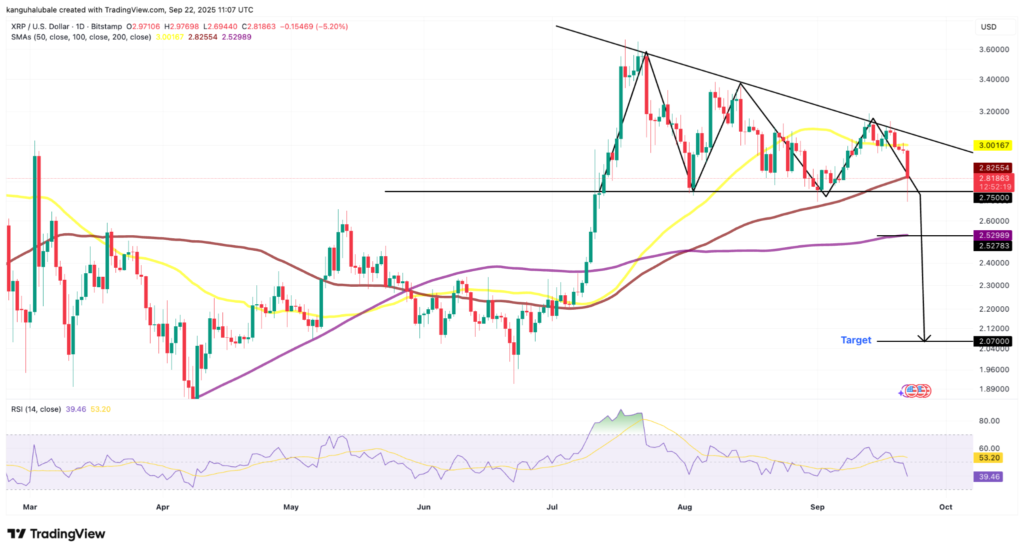
On the daily chart, XRP is forming a descending triangle, a bearish technical pattern characterized by lower highs and a flat support level, currently around $2.75.
A decisive close below this support could open the door for a deeper correction, possibly down to $2.07. That would represent a drop of more than 26% from current levels.
XRP/USD Weekly Chart
Source: TradingView
Weekly chart: Shows XRP consolidating within a bull flag pattern that began after the November 2024 rally. A breakout could target levels as high as $15.
CryptoBull, a popular analyst, sees a potential move to $5 in October, citing historical patterns and wave structures.
Egrag Crypto, another market watcher, points to an ascending triangle on the monthly chart, suggesting an ultimate target around $27.
XForceGlobal backs this long-term bullish outlook using Elliott Wave theory, predicting a cycle top above $20.
So while short-term volatility remains high, many traders view the current pullback as a technical correction within a broader uptrend.
Several key technical indicators are flashing warning signs:
50-day and 100-day SMAs: XRP has fallen below both, reinforcing bearish bias.
200-day SMA: Sitting near $2.52, this level could act as short-term support if the correction deepens.
RSI (Relative Strength Index): Currently at 39, down from 50 a day ago, showing increased selling momentum.
Net Unrealized Profit/Loss (NUPL): Now in the 0.5–0.6 zone, historically associated with local tops.
Over 94% of XRP supply is currently in profit, according to Glassnode, meaning that more holders may be tempted to sell, further increasing downward pressure.
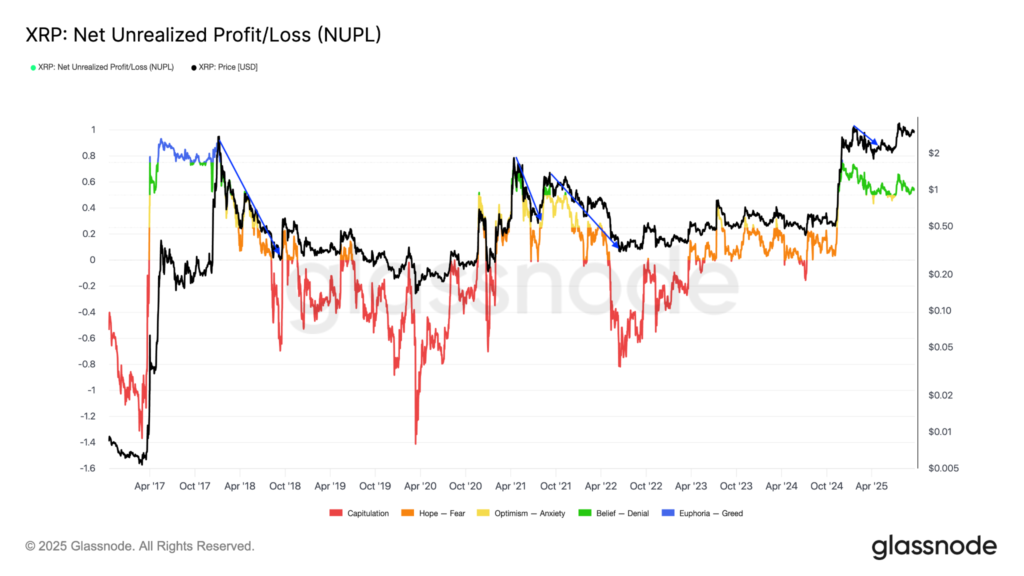
XRP’s NUPL Compared To Price Performance Chart
Source: Glassnode
Similar setups in 2017, 2021, and January 2025 preceded sharp pullbacks.
Not necessarily. While a drop below $3 raises short-term risks, several analysts see it as a technical pullback rather than the beginning of a long-term downtrend.
The next key support is around $2.75. If this breaks, XRP could fall to $2.07 based on the descending triangle pattern.
Yes. Some analysts maintain a bullish XRP price prediction, citing macro chart patterns with targets ranging from $5 to $27.
XRP’s current NUPL score suggests many holders are in profit, which often precedes short-term corrections due to increased selling.