
The cryptocurrency market is no stranger to bold predictions, but the latest Bitcoin price prediction based on technical chart analysis could signal one of the most significant bull runs in BTC history.
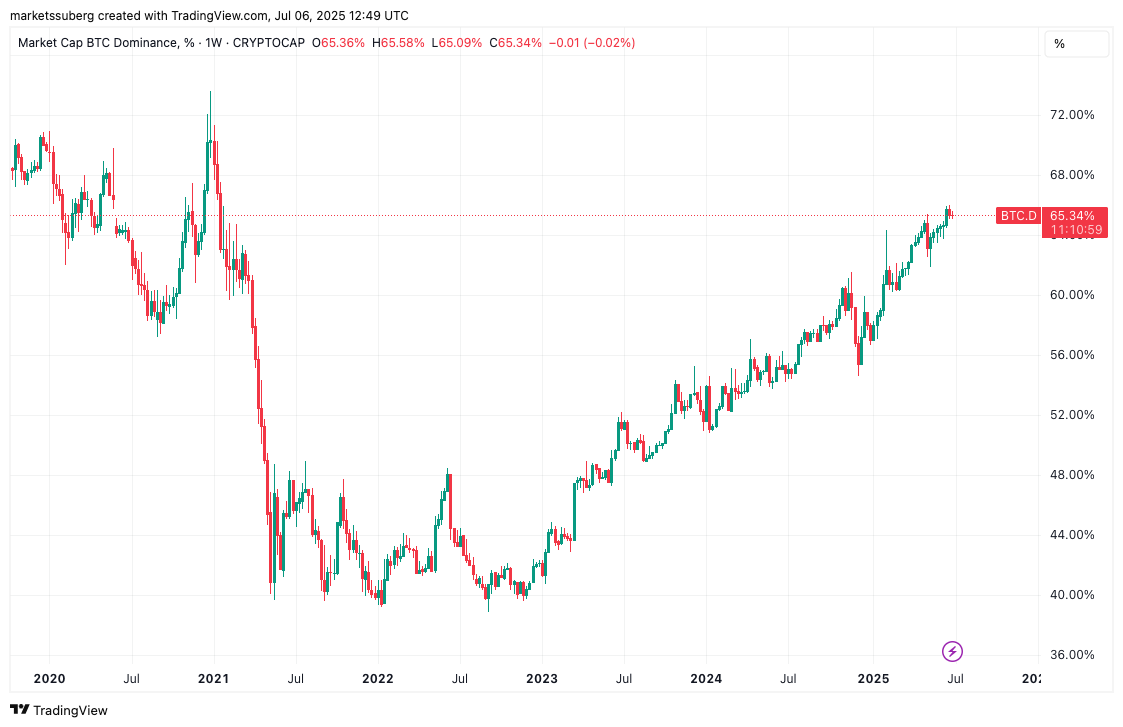
Bitcoin’s Price Analysis
Source: TradingView
This analysis comes as Bitcoin continues to consolidate within a relatively tight trading range, fueling speculation that a major move may be imminent.
The cup and handle pattern is a well-known chart formation in technical analysis, typically recognized as a bullish continuation setup. It features:
Historically, this pattern has been associated with strong rallies in both equities and crypto markets. Once the breakout occurs, the asset typically enters a parabolic phase, often surpassing previous all-time highs.
According to respected technical analyst Trader Alan, Bitcoin has completed this exact pattern on the monthly timeframe. The structure began with the previous peak in late 2021, followed by a deep correction into 2022, and a steady recovery throughout 2023 and 2024.
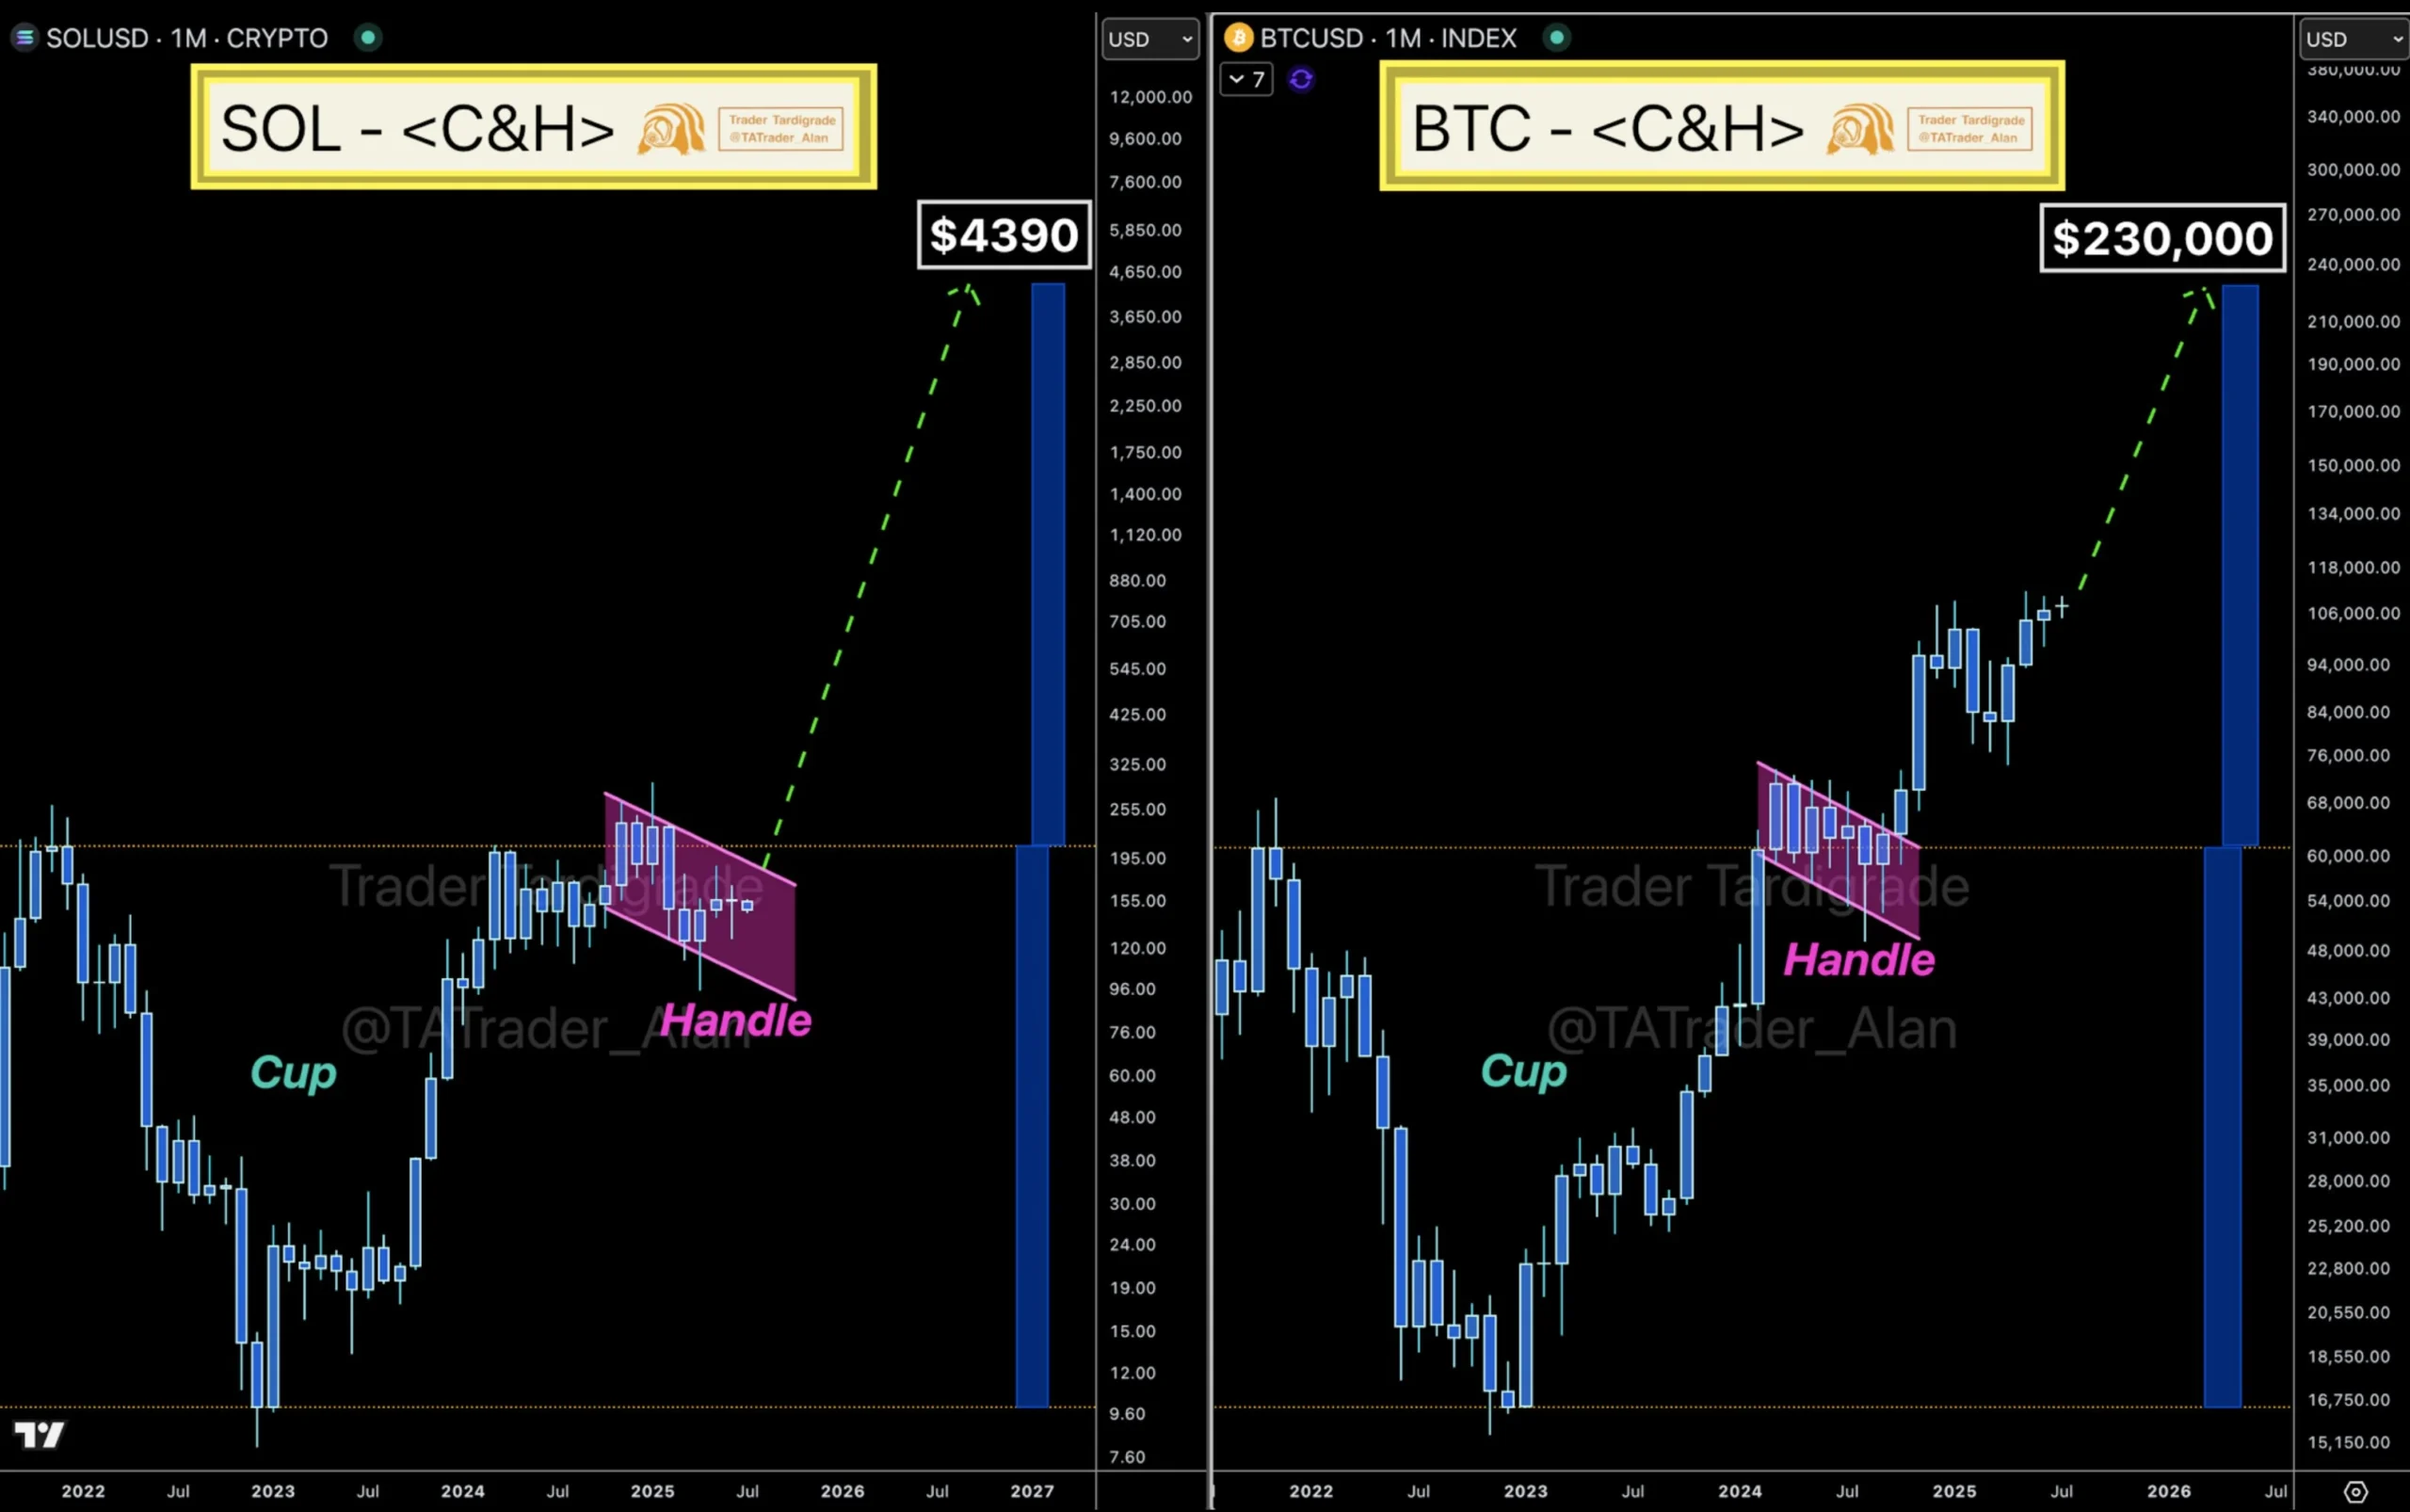
Bitcoin And Solana’s Cup & Handle Patterns
Source: X (@TATrader_Alan)
With this breakout confirmed, the Bitcoin price prediction stands at $230,000, based on the technical height of the pattern.
The $230K target is derived by measuring the depth of the cup and projecting it upward from the breakout point.
This approach is common among traders and has historically provided accurate estimations for potential upside in similar chart structures.
As of now, Bitcoin is trading just above the $109,000 mark, well above its 2022 lows but still below the projected $230,000 target. The asset has been consolidating for the past seven weeks, creating a narrow trading band between $102,000 and $112,000.
This consolidation is seen by many as a healthy pause, giving bulls time to accumulate and reduce volatility before the next leg upward.
Before Bitcoin can hit $230,000, it must overcome several important technical levels:
If the breakout fails or momentum weakens, BTC could find support at:
Yes, the cup and handle pattern is a time-tested bullish signal used across financial markets. In Bitcoin, it has previously signaled major upward moves. While not foolproof, it adds significant weight when confirmed on higher timeframes like the monthly chart.
Technical targets don’t come with guaranteed timelines, but if momentum continues and macro conditions are favorable, BTC could approach the $230K level within the next 6 to 12 months. However, delays are possible depending on market sentiment and external factors.
According to analysts like Trader Alan, yes, Bitcoin has broken out of its handle structure. Confirmation depends on sustained price action above the $100,000 breakout point and increasing volume.
That depends on your risk profile and investment horizon. With a technical breakout confirmed, long-term investors may see current levels as a strong entry point. However, short-term volatility is always a risk in crypto markets.