
The Bitcoin Coinbase Premium index flipped negative as BTC dropped below $104,000, signaling short-term selling pressure.
Bitcoin’s RSI reached its lowest level since April, suggesting oversold conditions and a potential bottom zone.
The 200-day EMA remains a critical support level that BTC must hold to maintain its bullish structure.
Increased taker sell volume and rejection near the short-term holder realized price hint at possible short-term capitulation.
Historical price patterns indicate BTC may consolidate for several weeks before a gradual recovery.
The Bitcoin Coinbase Premium measures the price difference of BTC on Coinbase compared to other exchanges.
A positive premium indicates strong demand from US-based investors on Coinbase, often seen as a bullish signal. Conversely, a negative premium can imply weaker buying pressure or increased selling activity.
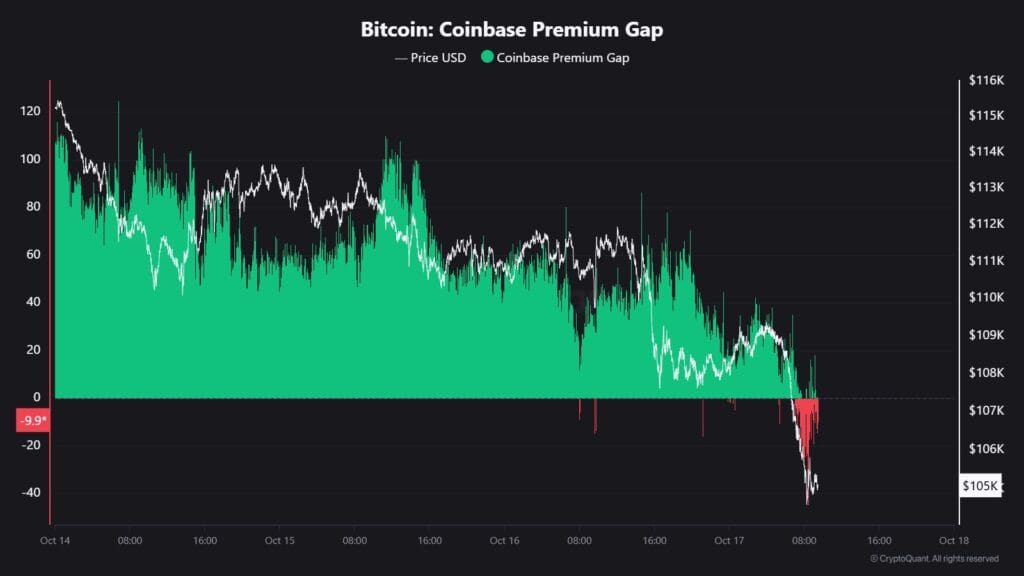
Bitcoin Coinbase Premium Gap
Source: CryptoQuant
In recent weeks, the premium had been positive, reflecting steady US spot demand. However, with Bitcoin’s price slipping below $104,000, this premium index flipped red on the hourly chart, marking the first negative reading in several weeks.
On Friday, Bitcoin extended its decline, dipping to around $103,500. This move triggered a shift in on-chain market sentiment, reflected by the negative Bitcoin Coinbase Premium on short-term timeframes.
Earlier in the week, BTC briefly found support near $110,000. The premium even spiked to 0.18, its highest since March 2024, indicating strong US investor interest. But when the price failed to hold above $110,000 on Thursday, confidence waned.
While the hourly premium turned negative, the daily premium remained marginally positive, suggesting that long-term US buying support still exists but is currently under strain.
Adding to bearish sentiment, Bitcoin’s taker sell volume surged above $4 billion, indicating a wave of market sell orders.
This coincided with BTC facing rejection near the short-term holder (STH) realized price level at approximately $112,370, a critical resistance zone.
The aforementioned level represents the average cost basis for recent buyers.
Sustained rejection below this price could accelerate short-term capitulation, pushing BTC toward the psychological $100,000 mark.
BTC’s recent price action bears strong resemblance to the March–April bottom zone earlier this year. Back then, sharp intraday wicks cleared liquidity accumulated over 30 days, followed by a gradual recovery.
This fractal suggests BTC might retest the $100,000 range without breaking the broader bullish trend, unless it decisively drops below this level.
Bitcoin’s RSI dropped to 34, matching the April low point that preceded a recovery. This is often viewed as an oversold zone, indicating the potential for a bounce.
Another key technical indicator is the 200-day exponential moving average (EMA). Bitcoin has held above this level for nearly six months, signaling a strong underlying trend.
From October 2024 to March 2025, BTC respected this EMA before a brief consolidation period.
Since April 2025, BTC has again stayed above this trendline.
However, recent price action threatens to break below the 200-day EMA, which would signal increased downside risk.
Crypto analyst ‘Dentoshi’ summarized the current market outlook:
“$BTC has consistently bottomed around the 3-day 100 EMA this bull run, but it’s taken 45–96 days to do so.”
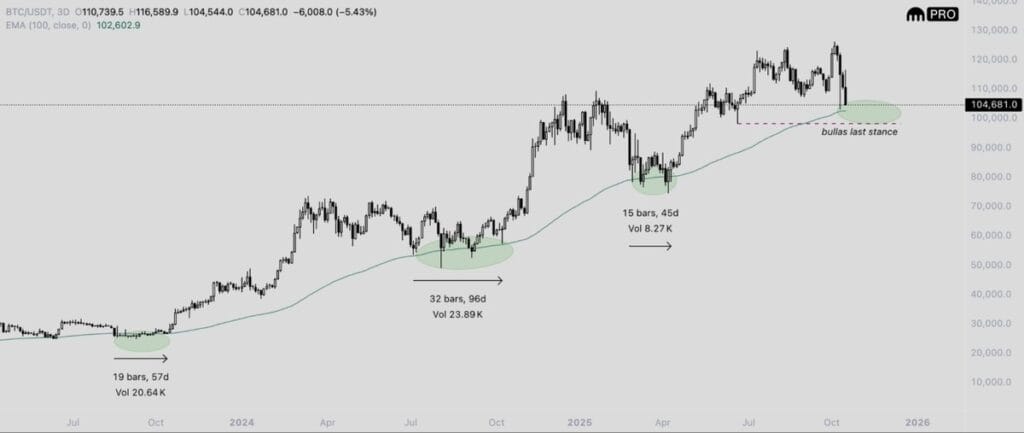
Bitcoin’s Three Day Chart
Source: X (@Dentoshi)
If BTC follows the prior fractal pattern, the market may enter a consolidation phase lasting several weeks. During Q1 2025, a similar bottom formation took about 45–55 days before a sustained recovery started in late April.
Applying this timeline, a gradual recovery might not fully materialize until late November or early December 2025.
A negative Bitcoin Coinbase Premium means that BTC is trading cheaper on Coinbase relative to other exchanges. This often reflects weaker demand or increased selling from US-based investors, potentially signaling bearish sentiment.
The RSI hitting the April low suggests Bitcoin is in an oversold condition similar to the one before the last recovery. This can act as a potential indicator for a market bottom or consolidation phase.
The 200-day EMA is a widely followed technical indicator that shows the long-term trend. Holding above it usually indicates sustained bullish momentum, while a break below could suggest a trend reversal or deeper correction.
While short-term capitulation risks exist if BTC breaks below key support levels, historical patterns show BTC has often rebounded after retesting the $100,000 zone without breaking its overall bullish trend.
Based on previous cycles, consolidation and bottom formation could last between 45 to 96 days, with a potential recovery phase emerging toward late November or early December 2025.