As BTC/USD attempts to break the $105,000 barrier, the market is seeing a mix of bullish and bearish signals that could dictate its next big move.
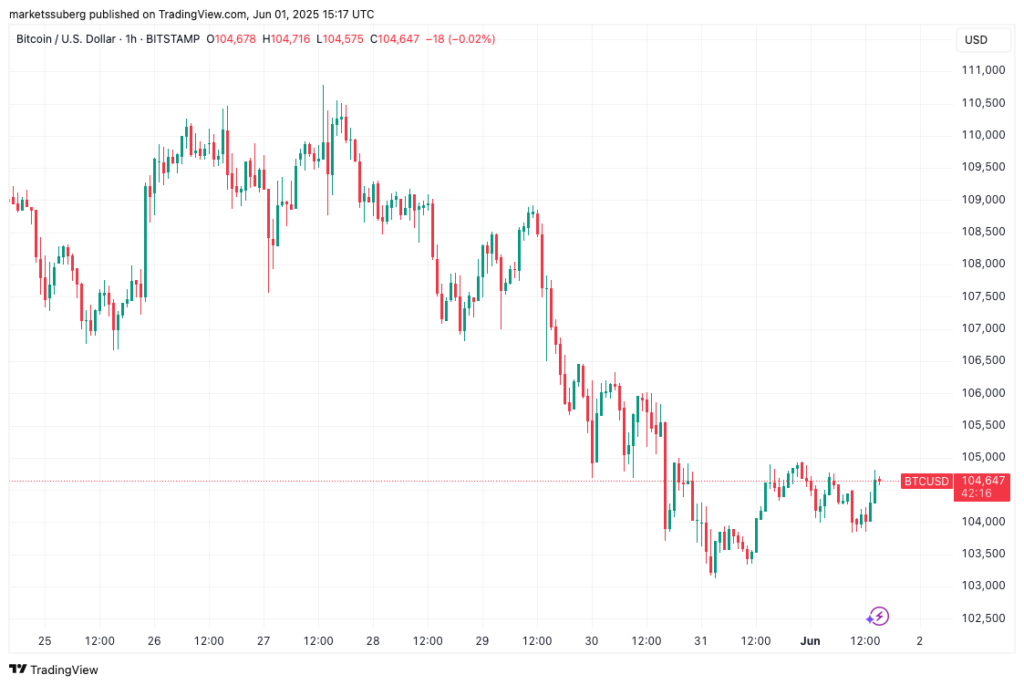
BTC/USD Hourly Chart
Source: TradingView
One of the most significant points of support lies around the local top from December 17th, 2024, when Bitcoin reached approximately $104,450. This price point continues to play a pivotal role in the current market structure.
As Bitcoin navigates these critical price levels, several key indicators are shaping the market sentiment:
‘Titan of Crypto’ pointed out that the bearish divergence on the weekly RSI chart could have significant implications for the bullish outlook. Titan warned that while the divergence remains unconfirmed, it’s worth keeping a close eye on the situation.
The trader also referenced Fibonacci retracement levels and noted two major fair value gaps (FVGs) to watch, one around $97,000 and another at $90,000. These price levels indicate potential areas of imbalance between buyers and sellers, which may come into play if BTC experiences a pullback.
Looking at order book liquidity data, the $100,000 level could serve as a psychological support zone if Bitcoin’s price continues to dip.
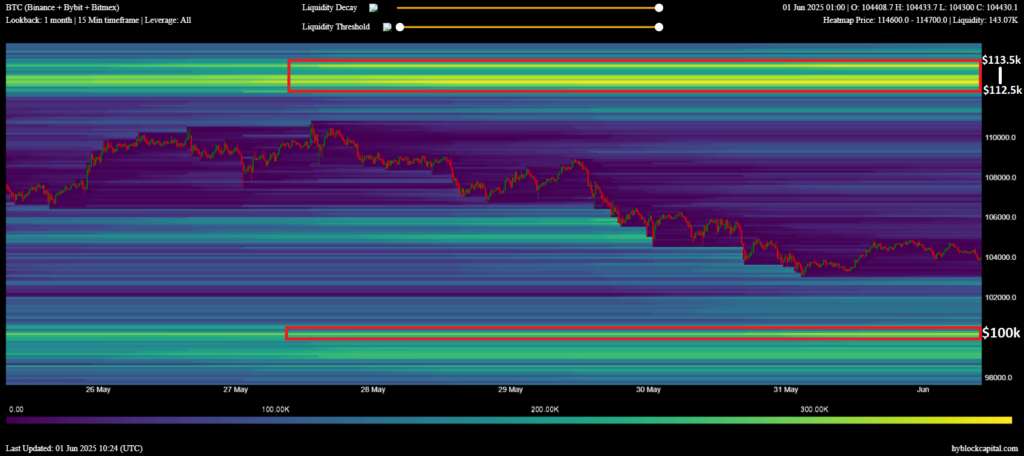
Bitcoin Liquidity Chart
Source: X (@CrypNuevo)
Despite the recent 8% drop in BTC’s price over the past week, traders remains optimistic about the larger market structure. Even a slight temporary drop below the $100K mark could make sense to shake out the market, but the overall trend remains bullish.
Why is the $100,000 level so significant for Bitcoin?
The $100,000 level is considered a strong psychological barrier for traders and investors. As a round number, it tends to attract both buying and selling activity, making it a key support or resistance point.
Additionally, order book liquidity often stacks around significant psychological levels, which can impact price action.
What is an RSI bearish divergence, and why does it matter?
RSI divergence occurs when the price of an asset moves in the opposite direction of the RSI, signaling a potential shift in momentum.
In this case, a bearish divergence suggests that even as BTC’s price rises, the momentum behind the move is weakening, which could signal an impending price correction.