An alternative perspective suggests that this range-bound activity for Bitcoin could be a classic bull flag consolidation, hinting at the potential for further upward momentum.
A bull flag is a technical continuation pattern that occurs after a strong upward price movement. This is followed by a phase of sideways or slightly downward movement, forming a flag-like shape on the chart. If Bitcoin manages to break above this pattern’s upper resistance line, it could signal the resumption of its previous uptrend.
Bull flag formations are typically bullish indicators when accompanied by consolidating volume and strong fundamentals, analysts note.
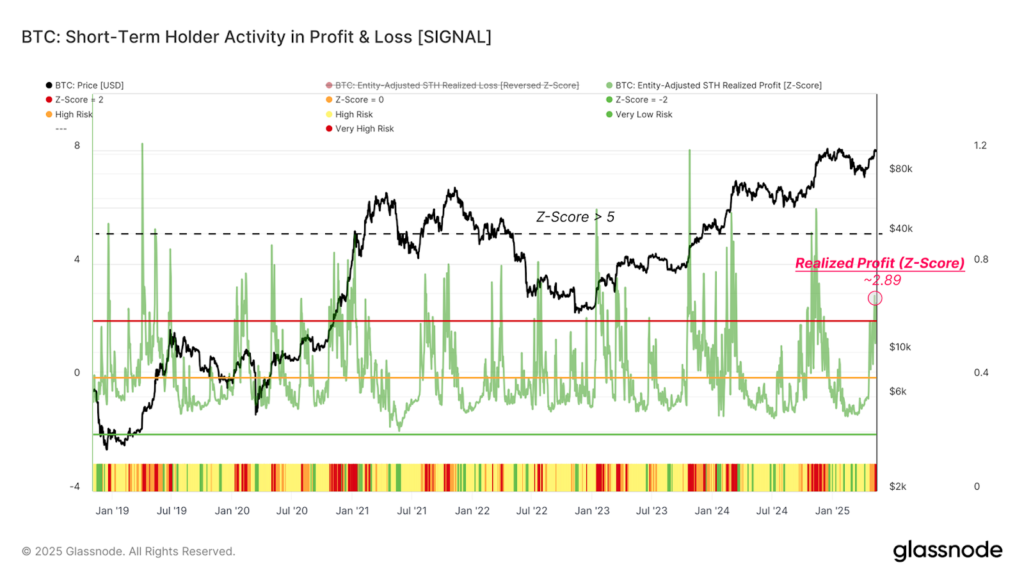
Source: Glassnode
At the moment, Bitcoin appears to be in this flagging pattern, as traders remain indecisive. However, the lack of significant buy volume is a key factor keeping BTC pinned below the critical resistance zone.
As shown in recent data from TRDR.io, Bitcoin’s explosive rally from $74,400 to nearly $106,000 was accompanied by a sharp spike in liquidations and strong spot volume, a rally also supported by billion-dollar inflows into U.S.-listed spot Bitcoin ETFs.
During that three-week surge, a number of U.S. and international firms announced Bitcoin purchases, adding to their corporate treasuries. Despite this, current trading patterns suggest sellers are taking profit near the top of the range, while buyers are hesitant to open new high-leverage or large spot positions at these levels.
Data from TRDR.io illustrates this dynamic, showing limited use of margin leverage on the way up and a consistent accumulation pattern on dips toward the lower boundary of the bull flag. In essence, while demand remains present at lower levels, there’s a noticeable lack of aggressive buying at the highs.
The recent slowdown in Bitcoin’s momentum appears to be a normal cooling phase following a 40% recovery that began on April 8th. Analysts believe this pullback is largely driven by profit-taking in the futures market, an expected behavior following such a sharp run-up.
This suggests that while profit-taking is happening, it has not reached a point where it threatens the ongoing bullish structure. If buying pressure resumes, Bitcoin could soon attempt another breakout.
With most of the visible sell-side liquidity seemingly absorbed during the surge toward $105,000, some analysts warn that Bitcoin may still need to test key support levels before climbing higher.
According to crypto analytics firm Material Indicators, unless a major bullish catalyst emerges, a temporary dip to $100,000 or even $90,000 remains possible.

Source: Material Indicators
Crypto analyst Daan Crypto Trades shared a similarly cautious but optimistic view with his followers on X. He pointed out that many of the macro narratives affecting Bitcoin’s price, such as regulatory uncertainty and ETF inflows, have already played out, allowing the market to refocus on price action and broader financial conditions.
In his words:
“Most of the bullish and bearish news has already been priced in. $90K remains my personal threshold for long-term spot exposure. As long as we stay above that, I remain cautiously bullish, especially if U.S. equities hold strong.”
He also cautioned that if stock markets experience a short-term correction, Bitcoin could follow suit:
“With many major equities having surged 30% to 50% in a month, a pullback would not be surprising. If that happens, expect BTC to test support levels before the next move up.”
While Bitcoin remains range-bound beneath the $105,000 mark, the technical picture suggests this is part of a broader bullish structure, potentially setting the stage for a major breakout. However, caution remains warranted as profit-taking increases and traditional markets could influence short-term price action.