
Bitcoin’s price dropped from around $118,330 on Friday to $112,300 by Sunday.
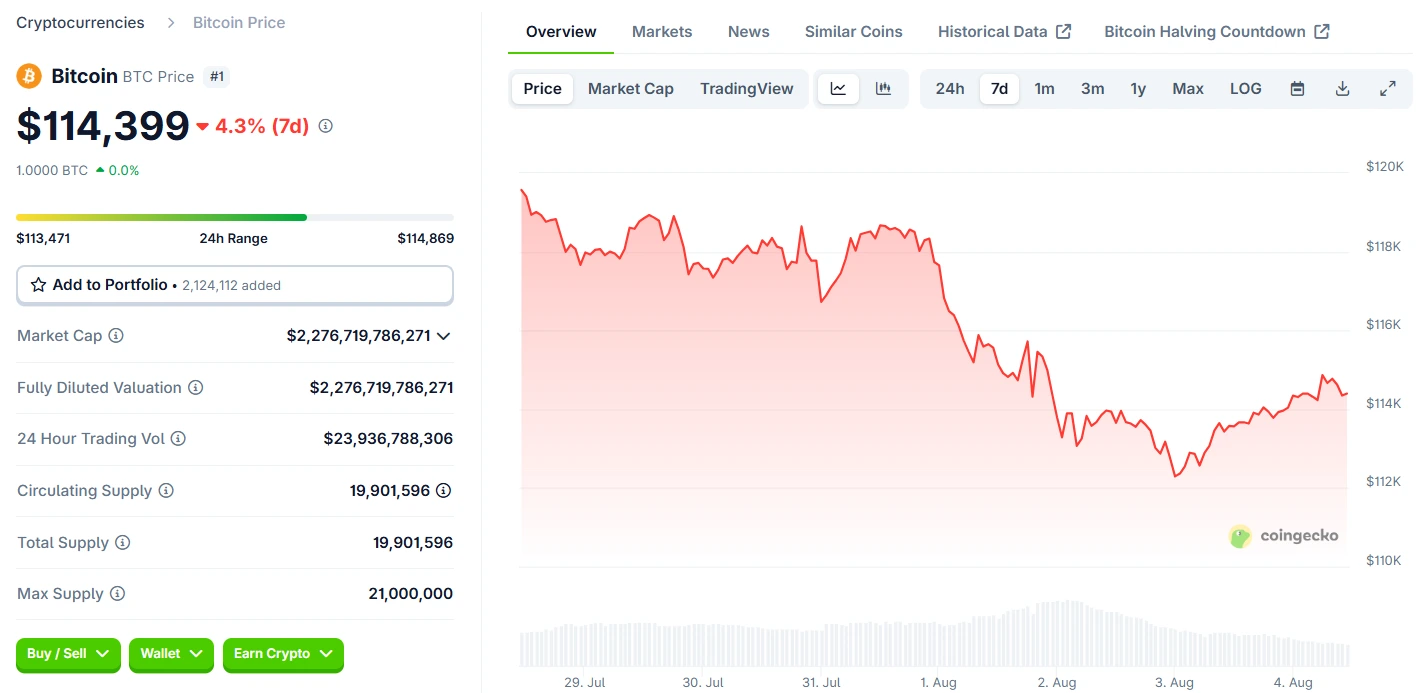
Bitcoin’s Price On 4th August 2025
Source: CoinGecko
This decline was not unexpected by market watchers familiar with Bitcoin’s August behavior. IG Markets analyst Tony Sycamore commented on the situation, stating that Bitcoin’s recent correction tested the logical support zone near $112,000.
As of Monday, Bitcoin had recovered slightly, climbing back to $114,800. But the market remains cautious.
If Bitcoin falls below $110,000 with conviction, analysts warn that the correction could deepen, possibly revisiting the 200-day MA near $99,000.
Data from CoinGlass reveals a consistent pattern of negative performance in Augusts dating back to 2013. In fact, Bitcoin has seen price declines in eight out of the past twelve Augusts.
The average August loss is 11.4%, suggesting that Bitcoin could potentially drop to around $105,000 if this trend continues in 2025.
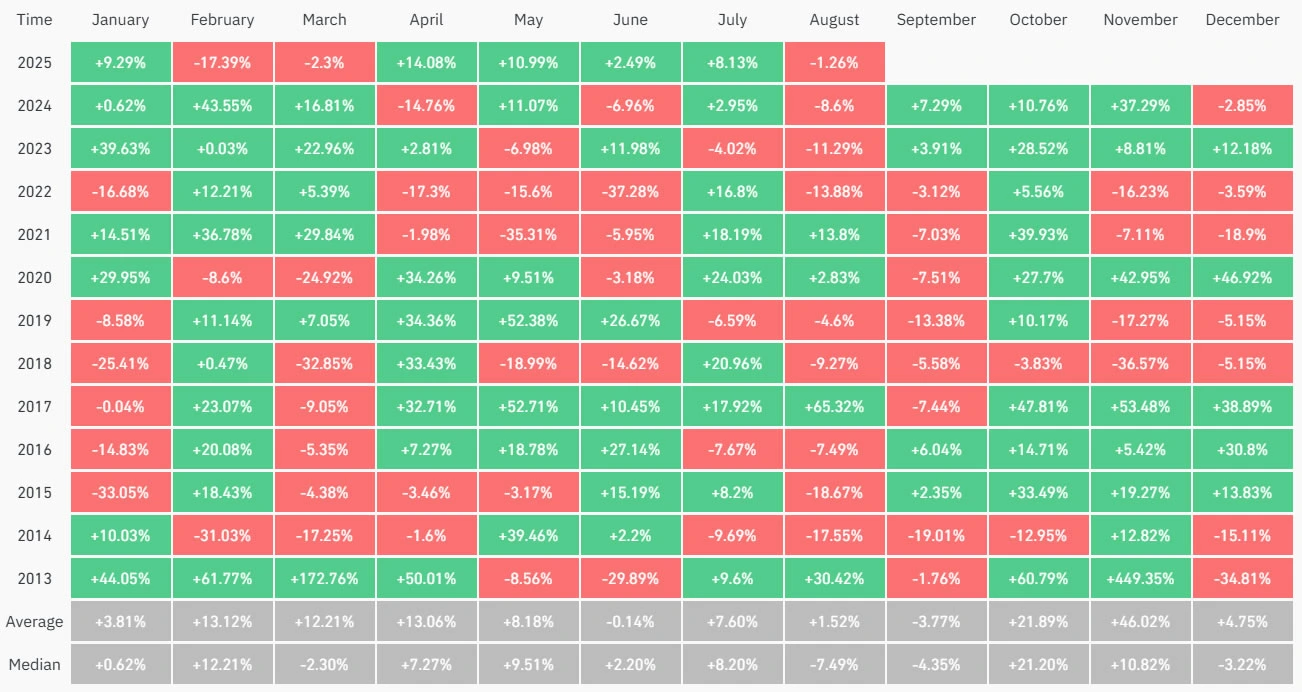
Bitcoin Losses In Past Augusts
Source: CoinGlass
While history may be bearish, 2025 is part of a bull market cycle, often following the four-year halving pattern.
This could mean that while the short-term outlook appears negative, there is potential for a reversal later in the year, especially if macroeconomic factors stabilize.
Recent developments in U.S. jobs data and trade tariffs are creating uncertainty in global risk markets. Analyst Arthur Hayes has also warned that macro pressures could drag BTC back down toward the $100,000 mark.
Hayes stated in a blog post:
“If risk appetite weakens further, we could see Bitcoin slipping below six figures again.”
Even if Bitcoin survives August, history suggests that September may offer little relief.
Like August, it has produced negative returns in eight out of the last 12 years, making it one of the worst months for BTC historically.
Based on historical averages and current market structure, Bitcoin could dip to around $105,000 if the bearish August pattern continues. However, bullish reversals are possible if macroeconomic conditions improve.
August typically sees reduced trading volumes, summer holidays, and occasional macroeconomic instability, all of which contribute to weaker price action.
A break below this key support could see Bitcoin drop toward the $99,000 level, which aligns with its 200-day moving average.
Historically, September is also weak, with eight out of the last 12 years showing negative returns. It’s important to manage expectations accordingly.
It’s possible but unlikely without a strong catalyst. Key resistance lies at $125,000, and breaking it would likely require improved risk sentiment or favorable macro developments.