Bitcoin reached $111.3K ahead of the weekly close, showing strength after recent macro-driven dips.
Resistance at $112K–$113K is critical; a breakout could signal a move to new highs.
Fibonacci and SMA analysis suggest a dip to $100K would be a healthy correction, not a bearish collapse.
The worst-case scenario predicted by analysts is a 10% drop before a possible rally to $150K.
Traders remain divided but cautiously optimistic in their Bitcoin price predictions for Q4 2025.
After dipping in response to recent U.S. macroeconomic data, Bitcoin (BTC) regained strength over the weekend, tapping local highs of $111,369, according to TradingView.
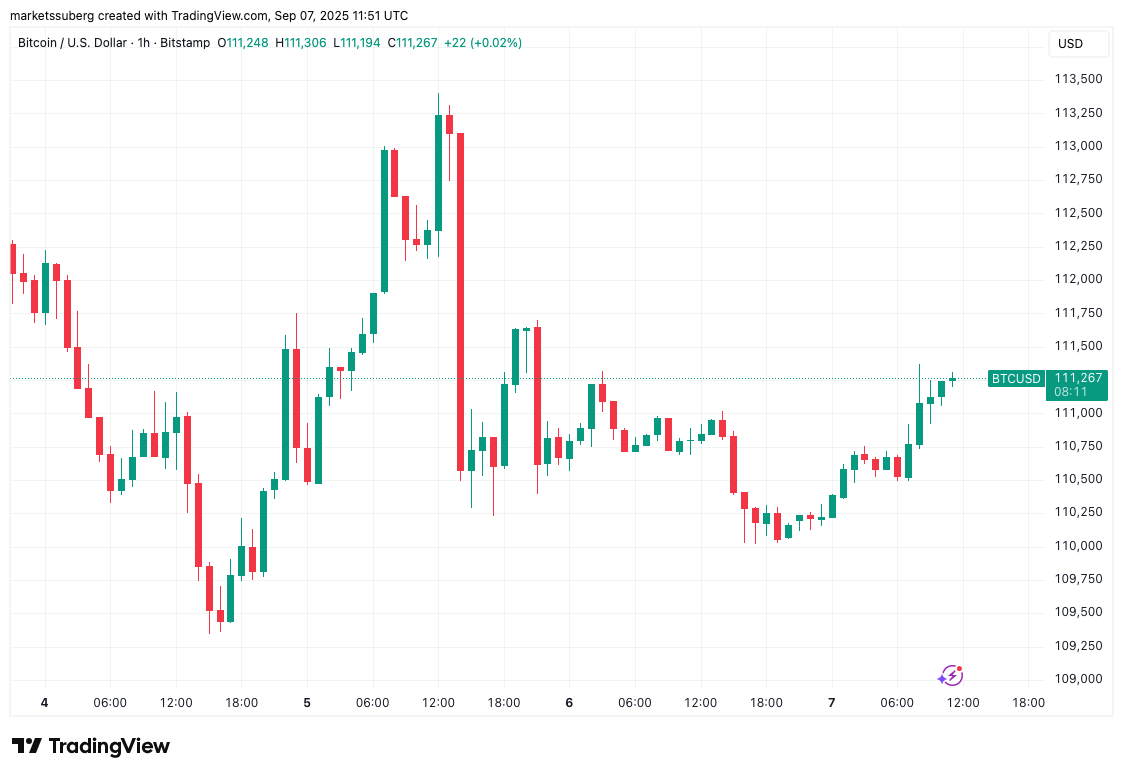
BTC/USD Hourly Chart – September 7th, 2025
Source: TradingView
This marks a 1% gain for the day as bulls managed to protect the $110,000 support level. Analyst Michaël van de Poppe said:
“This is actually promising on $BTC. It makes a new higher low and holds the support at $110K. Would be great if we crack $112K and fire up the bull run.”
While the bounce is encouraging, resistance at the $112,000–$113,000 zone looms large. Multiple traders believe this level is critical for determining Bitcoin’s next move. Crypto Tony said:
“We either flip $113,000 and pump to new highs, or if we reject here, we drop to $100,000.”
This makes the coming days especially pivotal for short-term traders focused on Bitcoin price prediction.
Technical analyst TurboBullCapital pointed to the 50-day SMA at $115,035 and the 200-day SMA at $101,760 as key zones. He wrote:
“Lose the $107K area & the downside target becomes the $101K level, which also happens to coincide with the MA200. This is a logical area to expect a bounce”.
These moving averages are considered significant in determining broader trend direction, and both bulls and bears are closely monitoring them.
Fibonacci retracement analysis offers further support for the idea of a potential dip, but not a catastrophic one. ZYN, a popular crypto trader, said:
“$BTC usually bottoms at the 0.382 Fibonacci level. This happened in Q3 2024, Q2 2025 and will probably happen again. That level is currently around $100K.”
This suggests that even in a bearish scenario, a correction to $100,000, roughly 10% down from current levels, may represent a healthy pullback before another leg higher.
While some traders fear rejection at resistance levels could open the door to a deeper pullback, others see any dip toward $100,000 as a buying opportunity, not a reason to panic.
There’s also speculation that whales and market makers could be manipulating short-term price action before triggering a major short squeeze, similar to what was observed in late 2024.
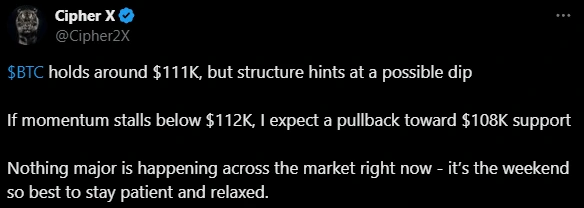
Source: X (@Cipher2X)
With Bitcoin trading near the $111K–$113K resistance range, short-term Bitcoin price predictions remain divided:
A bullish breakout above $113,000 could see BTC target new all-time highs, potentially accelerating toward $150,000.
A bearish rejection could drive the price down to $100,000, aligning with key technical indicators like the 200-day SMA and Fibonacci levels.
Given this context, many traders believe the worst-case scenario would be a 10% correction, far from a major crash.
As of the latest data, Bitcoin is trading around $111,212.
While anything is possible in crypto markets, analysts believe $100,000 is a strong support level and the 0.382 Fibonacci retracement level, which often acts as a price floor.
If BTC breaks above $113K, analysts foresee a rally toward $150,000, representing over 35% upside from current levels.
Key technical indicators include:
200-day and 50-day SMAs
Fibonacci retracement levels
Resistance at $112K–$113K
Many traders see a potential dip to $100K as a buying opportunity, especially if BTC holds support and maintains a higher low structure.