
BNB price prediction remains neutral to bearish below $850.
A breakout above $855 is needed for any bullish momentum to resume.
Immediate support lies between $845 and $835.
Technical indicators like MACD and RSI show weakening bullish signals.
A drop below $835 could open doors for a move toward $800.
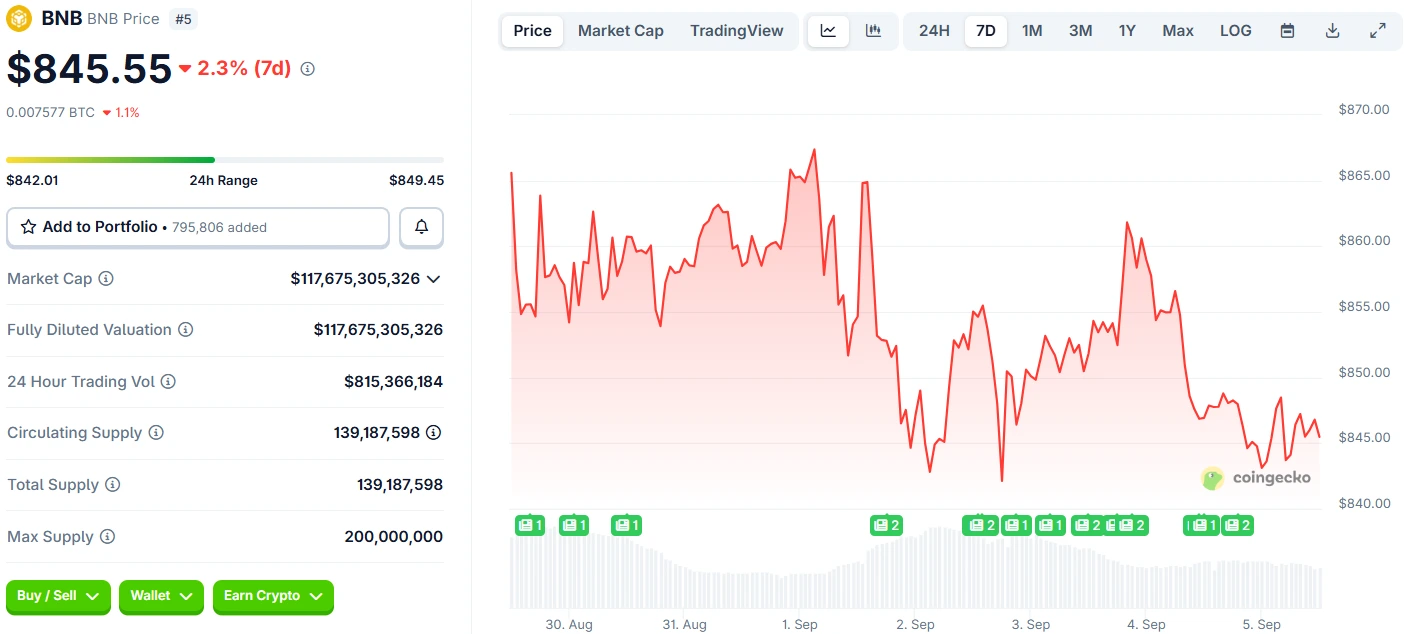
BNB is showing signs of weakness, consolidating below the critical $850 mark.
Bitcoin’s Price Analysis (5th September 2025)
Source: CoinGecko
Similar to Bitcoin (BTC) and Ethereum (ETH), the token failed to break higher, indicating a potential shift in market sentiment.
Immediate Resistance: $850
Major Resistance: $855 and $865
Immediate Support: $845
Major Support: $842 and $835
The price is now trading beneath both the $850 mark and the 100-hourly Simple Moving Average (SMA), suggesting that bullish momentum is ending and bearish pressure is starting to dominate the short-term trend.
There’s a short-term contracting triangle forming, with support near $845. This triangle formation could lead to a breakout, but direction remains uncertain.
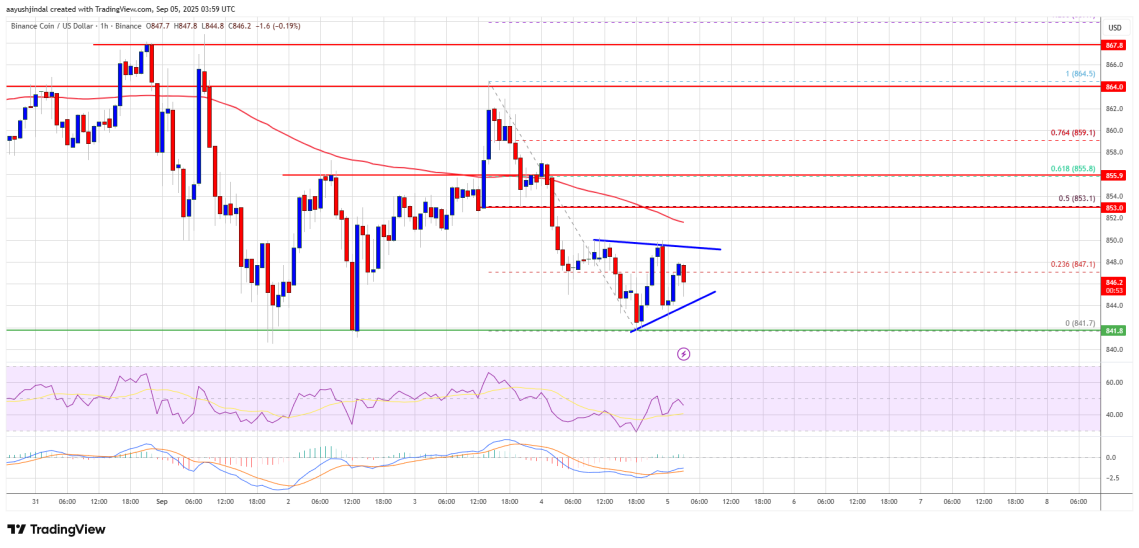
BNB/USD Analysis
Source: TradingView
The MACD is currently losing momentum in the bullish zone, hinting that buyers may be running out of steam.
The Relative Strength Index is below the 50 level, further confirming that bearish sentiment is gaining traction.
BNB has recovered slightly above the 23.6% Fib retracement level (from $864 to $842), but it still struggles to cross the stronger resistance at the 61.8% Fib level near $855.
If BNB manages to push above the $855 resistance, a retest of the $865 level is likely. A successful close above $865 could open doors for:
A rally toward the $880 resistance
Possible testing of $888 in the short term
This would mark a significant shift in momentum and could spark renewed interest from bulls.
$865: Key breakout point
$880: Short-term resistance
$888: Psychological level to watch
On the flip side, failure to break the $855 resistance could lead to another leg downward. Immediate support lies at $845, but a break below this level could trigger more significant losses.
$842: Immediate test point
$835: Strong support zone
$820 – $800: Bearish targets if breakdown occurs
A drop below $835 could confirm the bearish trend, with a possible move toward $820 or even $800 in the coming sessions.
Currently, BNB shows bearish tendencies as it trades below $850 and important moving averages. A push above $855 could change the sentiment.
A break below $835 would likely lead to further declines toward $820 or $800, which are critical psychological and technical levels.
Bulls should closely watch the $855 resistance. A strong move above it could lead to a short-term rally toward $865 and $880.
The MACD is slowing down in the bullish zone, and the RSI is under 50—both signaling a weakening upward momentum.
In the short term, BNB price prediction suggests a range-bound movement between $835 and $855, with a breakout likely to dictate the next trend direction.