After a volatile week, ADA found solid footing around the $0.75 support zone. This level has acted as a safety net for buyers, preventing further declines and enabling a potential bounce.

ADA 4 Hour Chart
Source: TradingView
The recent dip tested the patience of traders, but strong buying pressure near $0.75 suggests that long-term investors remain confident.
The $0.75 mark is a crucial psychological and technical level. Historically, such supports tend to attract dip buyers who view it as an attractive entry point.
This defense against further losses may mark the start of a new upward trajectory, increasing the probability of Cardano breaking key resistance levels at $0.86 and $0.94.
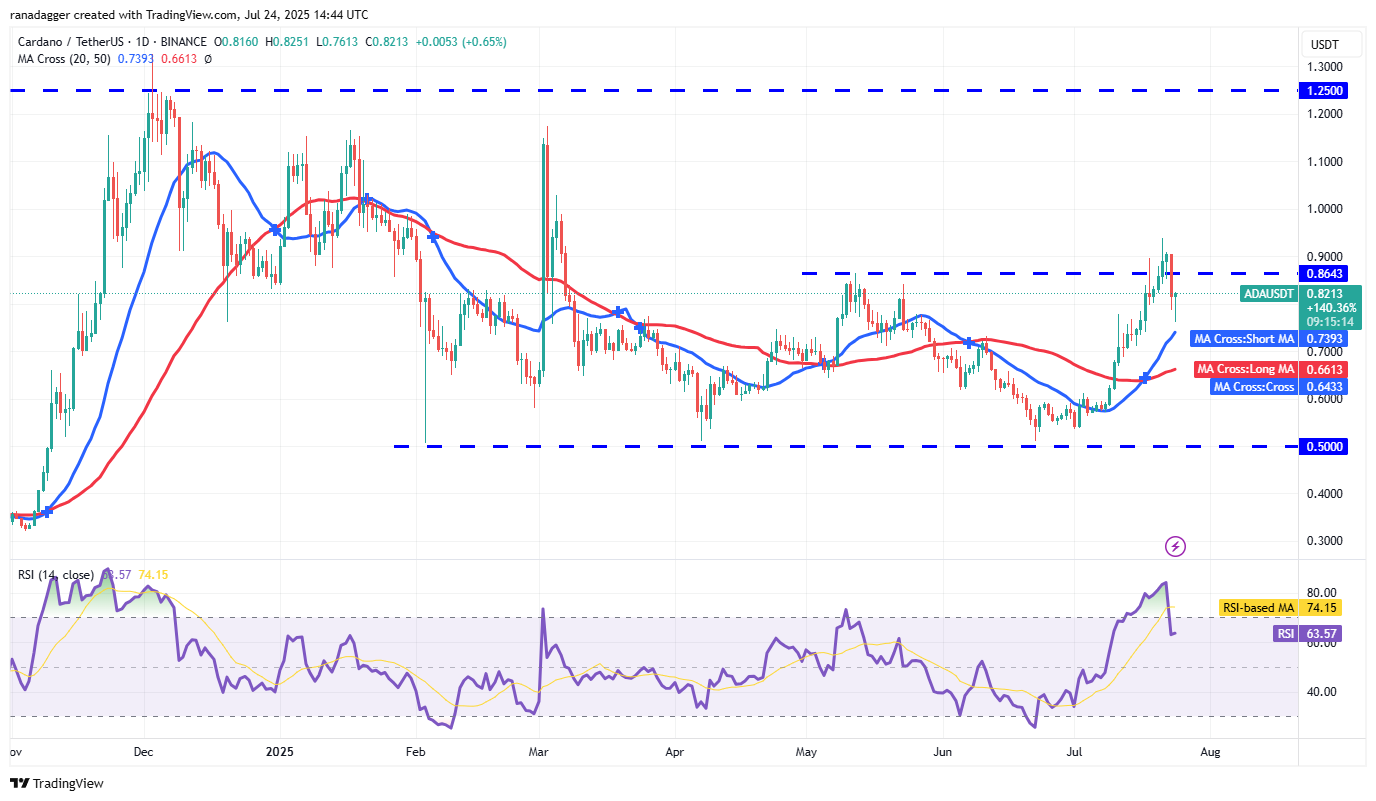
On Monday, ADA briefly broke above the $0.86 resistance, generating bullish momentum. However, the rally proved short-lived as bears pushed prices back below this level on Wednesday. This retracement was sharp, suggesting some traders may have taken profits or reacted to broader market pressures.
The decline brought ADA toward the 20-day simple moving average (SMA), currently around $0.73. Notably, the candlestick’s long tail at this level indicates buyers defended this area strongly.
On the 4-hour chart, the moving averages are nearing a bearish crossover, a sign that sellers could soon regain control in the short term. Recovery attempts may encounter resistance at the 20-SMA, and a failure to break above this could signal further downside.
If ADA fails to hold above the 20-day SMA, the next major support to watch is the 50-day SMA near $0.66. A break below that level could trigger a steeper decline, with prices potentially dropping to $0.70 or even $0.65 in the near term.
If buyers successfully push ADA above the 20-day SMA and break through the $0.94 resistance, the outlook turns bullish. Such a breakout would open the door for a rally toward $1.02 and possibly $1.17 as buying interest accelerates.
ADA Daily Chart
Source: TradingView
The key to this bullish scenario is sustained volume and momentum. Traders should monitor the price action closely at these resistance levels for confirmation of strength.
Conversely, if ADA fails to maintain support above $0.75 or breaks below the 20-day SMA, the recent breakout above $0.86 could be a false signal, often called a “bull trap.” This would likely lead to more selling pressure and a decline toward the 50-day SMA at $0.66.
In this case, weak hands may be shaken out, and the recovery to previous highs could be delayed. The depth and duration of any decline will influence the timing of the next leg up in ADA’s price trend.
Cardano’s price movement illustrates the classic pattern of volatile altcoin behavior, strong rallies followed by sharp pullbacks that test market conviction. Understanding these dynamics helps traders position themselves effectively.
Dip buyers defending support near $0.75 reflect confidence, but cautious traders should watch for confirmation of strength above $0.94 to enter new positions aggressively.
The key support level is around $0.75, where buyers have recently stepped in to prevent further declines.
Important resistance levels include $0.86 and $0.94. Breaking above $0.94 could lead ADA toward $1 and higher targets.
If the price breaks below the 20-day SMA (~$0.73), ADA may test the 50-day SMA near $0.66, indicating a possible deeper correction.
Buying near support levels could be advantageous, but wait for a confirmed breakout above resistance to reduce risk.