The recent rally appears to be driven largely by the enthusiasm and involvement of the Pi Network community. Community Sentiment, a metric provided by none other than CoinMarketCap, offers key insights into whether traders are feeling bullish or bearish on a particular token.
As of the time of this writing, PI boasts an impressive sentiment score of 88% on CoinMarketCap, reflecting overwhelming confidence among traders and holders that the token’s upward momentum will continue. This high sentiment has translated directly into price movement and market activity.
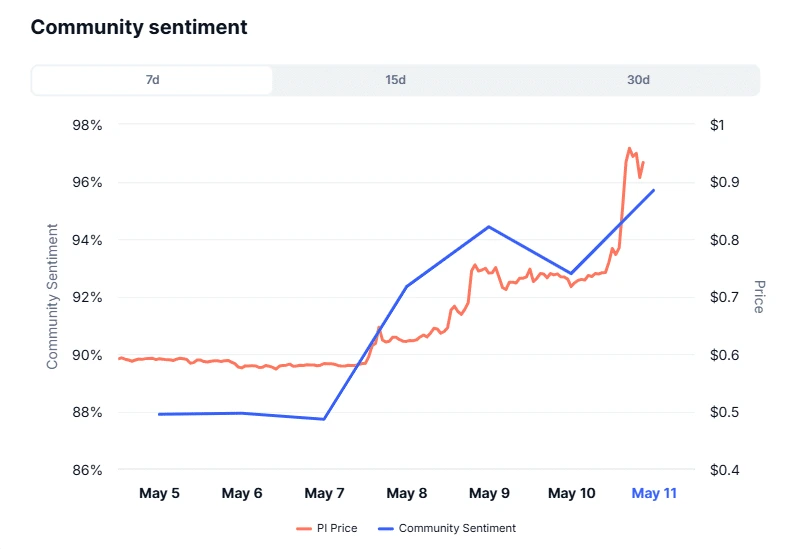
Source: CoinMarketCap
Over the past 24 hours, PI’s price jump was matched by a significant spike in trading volume. The volume surged by 155.25%, reaching $597.53 million, marking the highest daily trading volume for PI in the last 30 days.
This combination of rising price and volume typically signals a strong bullish trend, as increased interest and trading activity often precede further gains.
Beyond community enthusiasm, technical indicators also paint a revealing picture of where PI may be headed next in both the short and long term.
The Relative Strength Index (RSI), a key tool used to assess the pace and scale of price changes, currently stands at 76.13. Since an RSI above 70 is generally considered overbought, this reading suggests that the token may face short-term selling pressure as investors lock in profits.
However, despite the overbought condition, the Moving Average Convergence Divergence (MACD) indicator tells a more optimistic story.
Currently, the MACD line remains above the signal line (orange), and it has also entered the positive territory for the first time in recent weeks. These are bullish signs, typically indicating strong buying momentum and the potential for continued upward movement.
This technical setup suggests that any price correction could be relatively shallow, possibly driven by traders attempting to trigger lower entry points before the next rally begins.
Looking at the 1-day chart, PI has now arrived at a key resistance level. This aligns with the RSI’s overbought indication, reinforcing the possibility of a short-term pullback. However, analysts suggest this dip could be temporary and healthy for market consolidation.
If PI manages to break above this resistance with sustained volume and buying activity, it could quickly retest the $2 price zone, an area it previously exited during a broader market correction earlier this year.
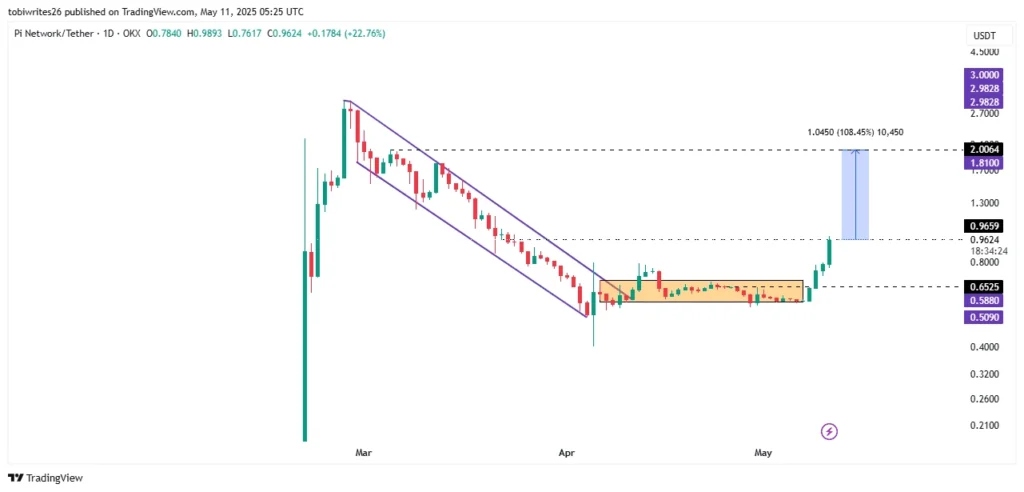
Source: TradingView
Notably, the $2 level represents the upper boundary of a descending channel pattern that PI had followed in prior weeks. Reclaiming this zone would not only indicate renewed investor confidence but could also signal a more extended bullish trend forming.
The rally to $2 and beyond will depend heavily on continued investor interest and buying pressure. With a highly engaged community and favorable technical indicators, the outlook remains positive, provided of course that momentum does not fade.
Nevertheless, while traders should be prepared for short-term corrections, the overall market structure appears to support the case for another upward leg.
As always, it’s important for investors to monitor both on-chain activity and sentiment indicators, as these can provide early warnings or confirmations of trend changes.
Pi Network’s recent 30% surge demonstrates the power of strong community backing and bullish sentiment.
With technical indicators still leaning positive despite near-term overbought signals, PI looks set to challenge the $2 mark again. If this does happen, then PI could very well establish itself as a major contender in the altcoin space.
For those watching the market, PI remains a token worth keeping an eye on in the coming days.