Market

Solana Struggles To Sustain ETF-Driven Rally

Solana surged 5% to touch $160 following news of its first ETF launching this week. However, the excitement was short-lived, as the altcoin quickly gave up its gains within 24 hours.
Solana ETF

Key Takeaways

  • SOL rallied 5% to $160 on ETF news but quickly reversed, reflecting market hesitation.

  • Price action remains weak, with SOL below key EMAs on the lower time frame.

  • Critical support lies between $145–$137; losing this zone could trigger a deeper pullback.

  • Broader trend remains bearish, with a descending channel still in play on the higher time frame.

  • UTXO data shows dense supply at $144.5–$147.7, making this a must-hold range for bulls.

ETF Launch Sparks Brief Rally

The announcement of Solana’s first ETF going live for trading on Wednesday provided a strong bullish catalyst. The token spiked from around $149 to $160 in just a few hours, catching the attention of investors and traders alike.
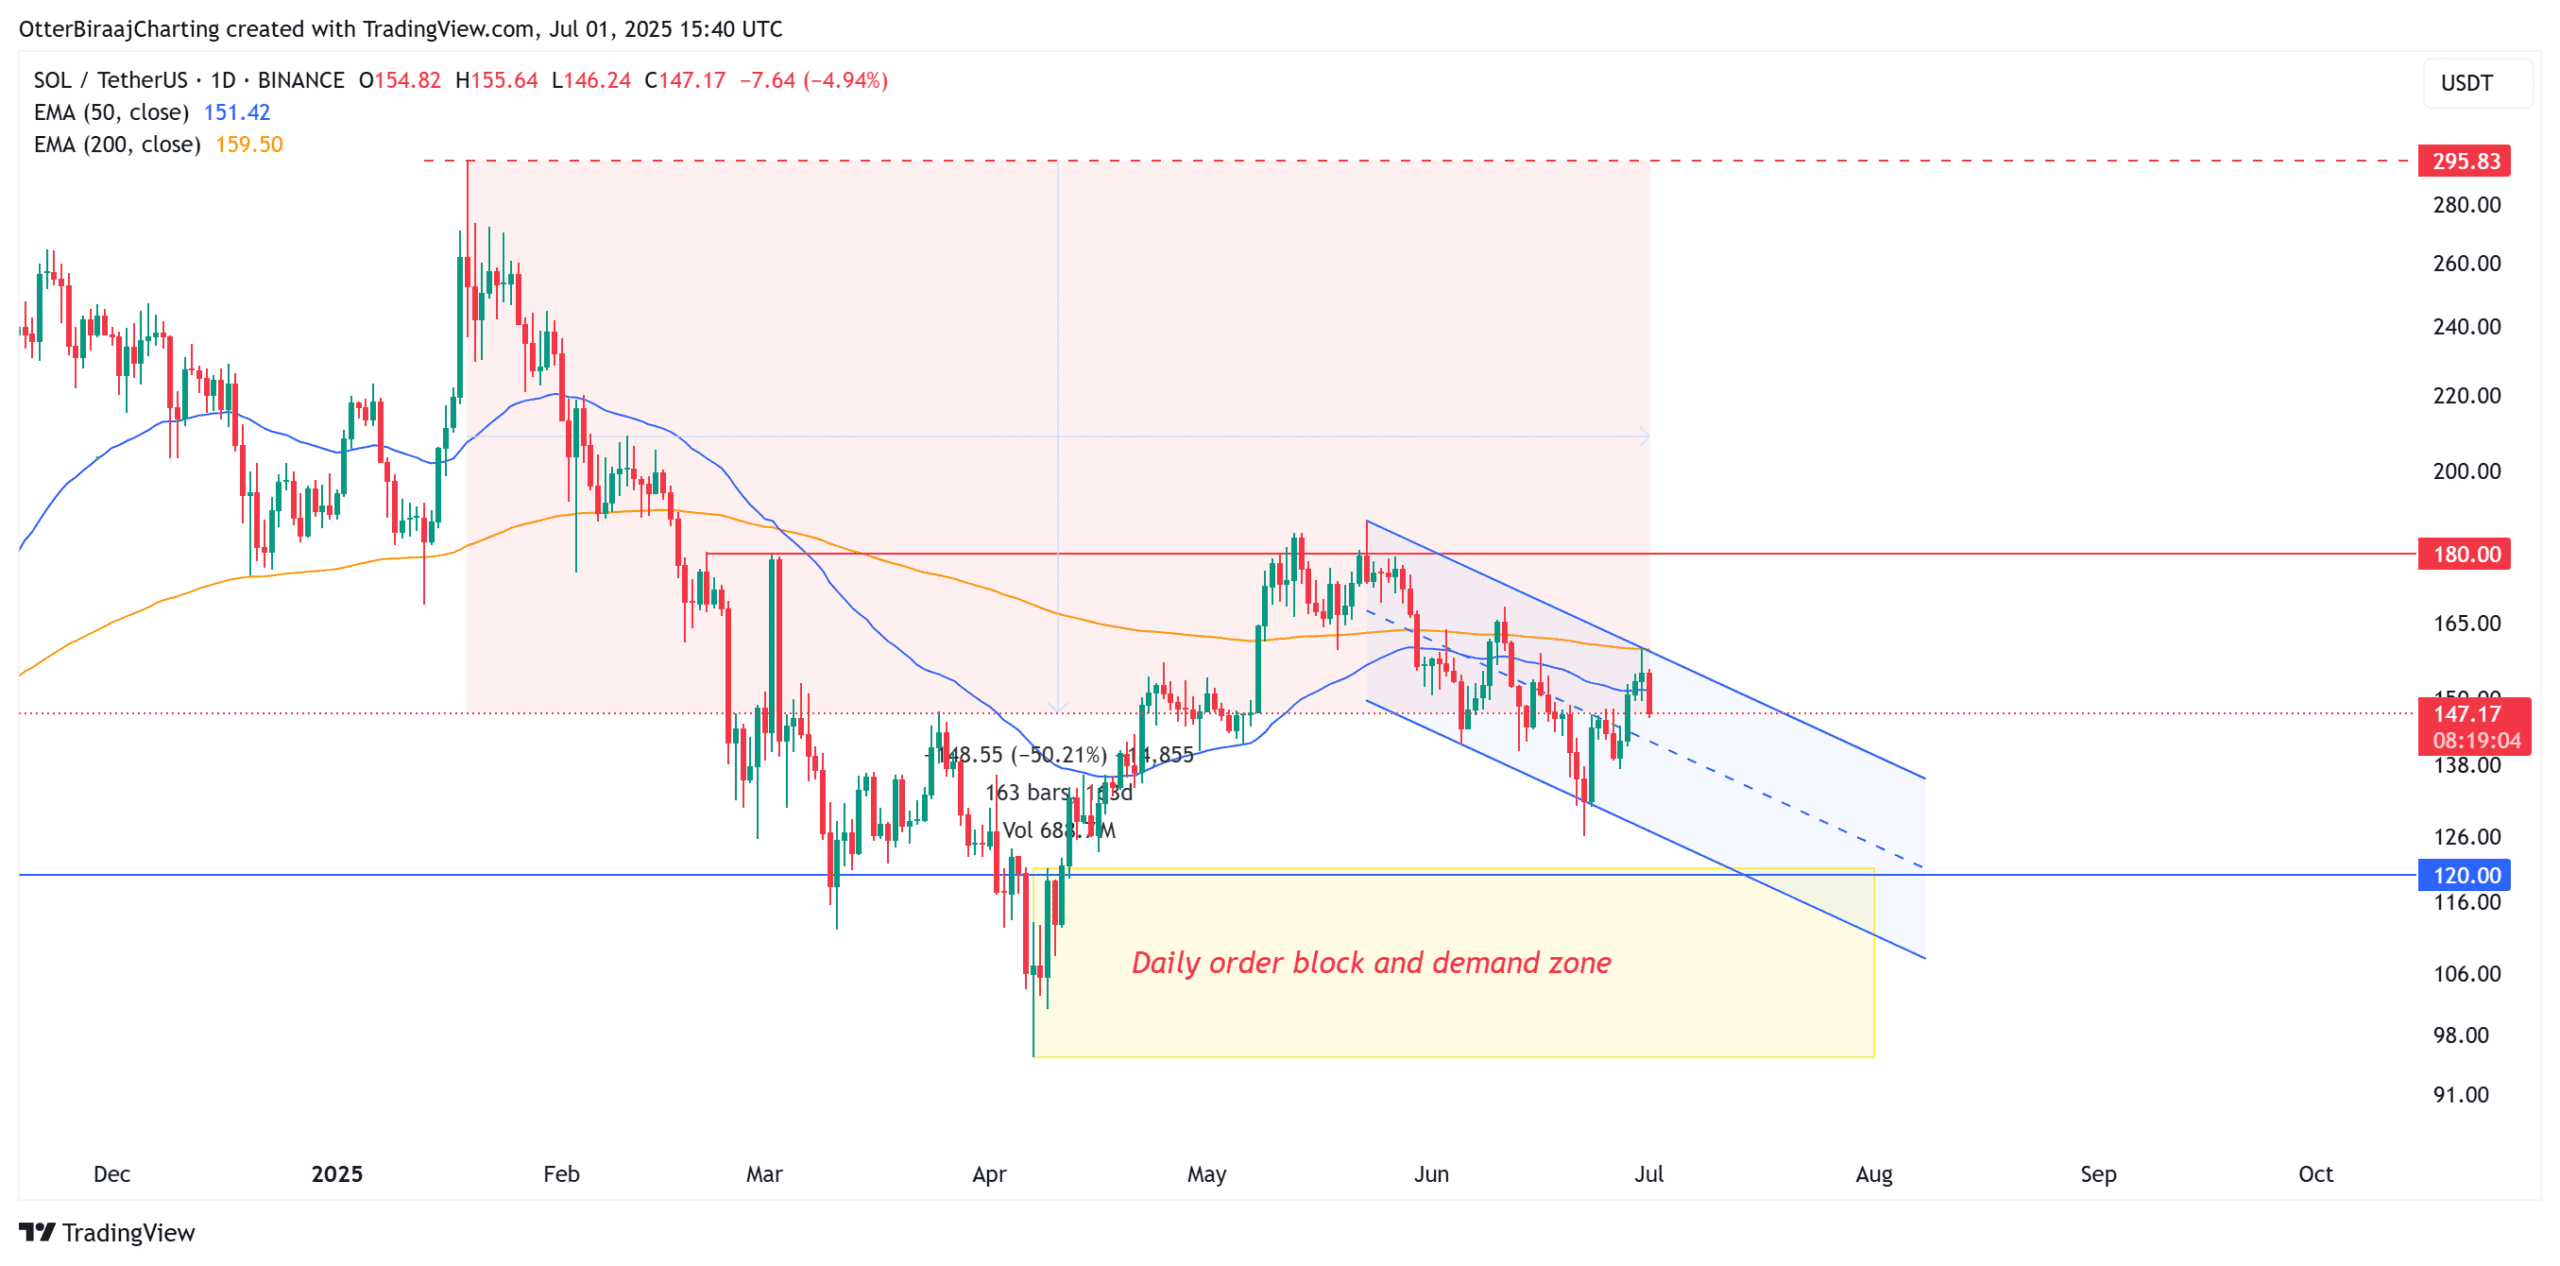
 

SOL Daily Chart

SOL Daily Chart

Source: TradingView


However, the breakout lacked follow-through, and selling pressure quickly dragged SOL back down.


Short-Term Price Structure Still Weak

Despite periodic break-of-structure signals in lower time frames, such as last week’s push above $148, Solana has been unable to maintain key support levels.

It has failed to stay above both the 50-day and 200-day exponential moving averages (EMAs) for over a month, which continues to weigh on market sentiment.

Key Levels to Watch

  • $148: Currently under pressure, acting as a near-term battleground for bulls and bears.

  • $137: A drop below this level would confirm a lower low, reinforcing the bearish outlook.

  • $145–$137: This demand zone is critical. A bounce from this range could rekindle bullish momentum.

  • $160: A reclaim of this level is needed for SOL to enter a sustainable uptrend.

Higher Time Frame Trends Paint A Bearish Picture

Zooming out to the daily chart reveals a broader downward trend. SOL has been trading within a descending channel since its failed attempt to break above the $180 resistance level in May.

This ongoing downtrend shows no signs of reversal yet, even as the market anticipates positive ETF developments.


SOL Lagging Behind Bitcoin

While Bitcoin (BTC) remains near its all-time highs, SOL has dropped almost 50% since January 19. This underperformance relative to BTC suggests that SOL is particularly vulnerable to market-wide corrections and sentiment shifts.

If bearish momentum continues, SOL could revisit the daily order block between $120 and $95, which would likely serve as a more favorable long-term accumulation zone.

Conversely, a strong daily close above $160 would be a significant bullish signal, potentially shifting sentiment and driving a breakout from the descending channel.


Key Support Zones

An analysis of Solana’s UTXO Realized Price Distribution (URPD), which maps where investors acquired their holdings, helps highlight crucial support and resistance zones.


SOL UTXO Price

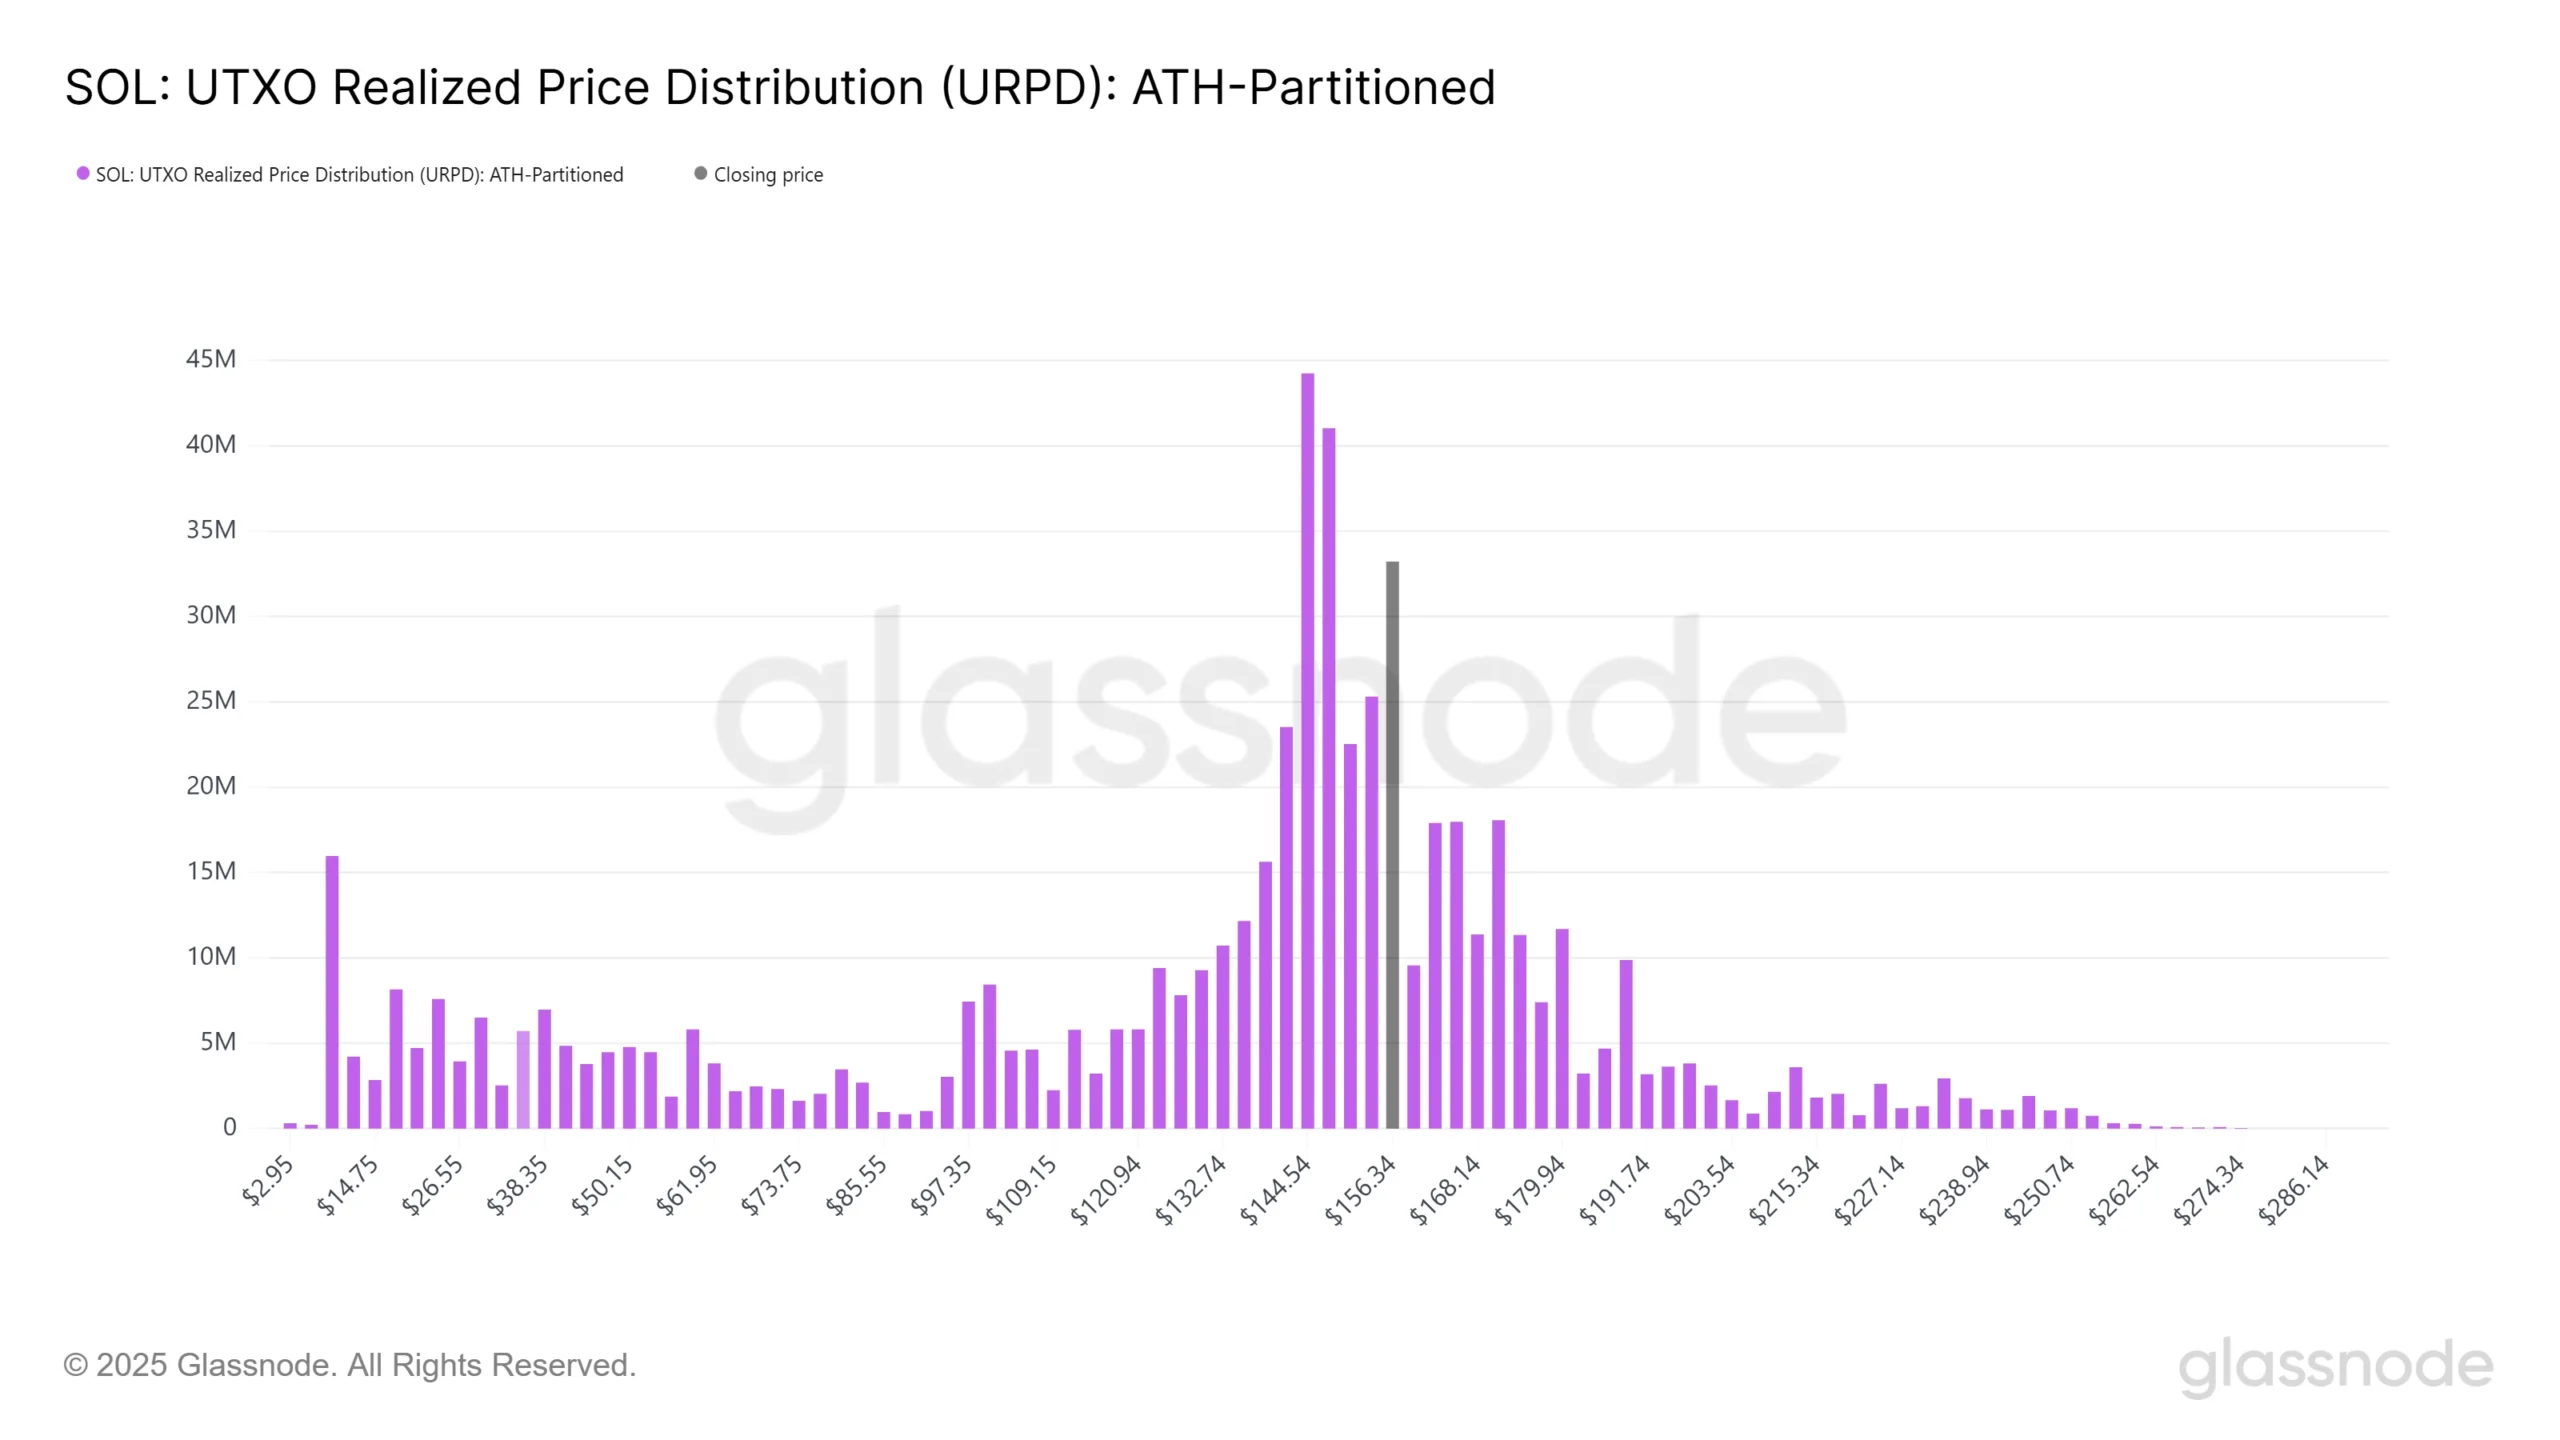
SOL UTXO Realized Price Distribution Chart

Source: Glassnode


Key URPD Zones for SOL

As of Tuesday, SOL trades near $148, placing it within a dense supply cluster between $144.5 and $147.7. This zone accounts for 14.3% of the circulating supply, marking it as a significant level of buyer interest.

  • Above $144: Remaining above this level is essential to avoid triggering further declines.

  • Below $144: A breakdown could lead to a test of lower support levels, particularly between $100 and $97, where 3% of supply resides.

Resistance Ahead

  • $157: Approximately 5.55% of the supply is held at this level, creating a key resistance point that could cap any short-term rallies.

While these data points suggest some strength in the current support range, failure to hold above it may result in rapid downside moves due to thinner supply layers below.

AltcoinCryptoETFMarketSolana

Join Our FREE Newsletter

Subscribe to stay informed and receive latest updates on the latest happenings in the crypto world!


By submitting this form, you are consenting to receive marketing emails from: Crypto Weekly. You can revoke your consent to receive emails at any time by using the SafeUnsubscribe® link, found at the bottom of every email. Emails are serviced by Constant Contact

Haider Jamal

Content Strategist

Haider is a fintech enthusiast and Content Strategist at CryptoWeekly with over four years in the Crypto & Blockchain industry. He began his writing journey with a blog after graduating from Monash University Malaysia. Passionate about storytelling and content creation, he blends creativity with insight. Haider is driven to grow professionally while always seeking the next big idea.

Read More >

Join Our FREE Newsletter

Subscribe to stay informed and receive latest updates on the latest happenings in the crypto world!


By submitting this form, you are consenting to receive marketing emails from: Crypto Weekly. You can revoke your consent to receive emails at any time by using the SafeUnsubscribe® link, found at the bottom of every email. Emails are serviced by Constant Contact

Search

Generic selectors
Exact matches only
Search in title
Search in content
Post Type Selectors

News: