One of the most notable developments in this Solana summer journey is the TD Sequential indicator flashing a buy signal on the daily chart. Historically, this pattern has been a strong indicator of potential market reversals.
According to crypto analyst ‘Ali Chart’, the TD Sequential’s buy signal comes at a critical juncture, just after Solana’s dip below $150. This could be a sign that selling pressure is weakening, opening the path for a potential rebound.
Still, traders are advised to wait for confirmation signals such as increased volume and sustained upward momentum. Without these, the risk of a false breakout remains high.
Fueling the optimism of the Solana Summer Crypto Exploration is a sharp rise in derivatives market activity. According to CoinGlass, Solana’s derivatives volume jumped by over 65%, indicating renewed interest and speculative positioning.
Alongside this, short liquidations hit an eye-catching $50.62 million, a clear sign that bearish traders were caught off-guard. As short positions get liquidated, the resulting buybacks create upward pressure on price, a phenomenon often referred to as a short squeeze.
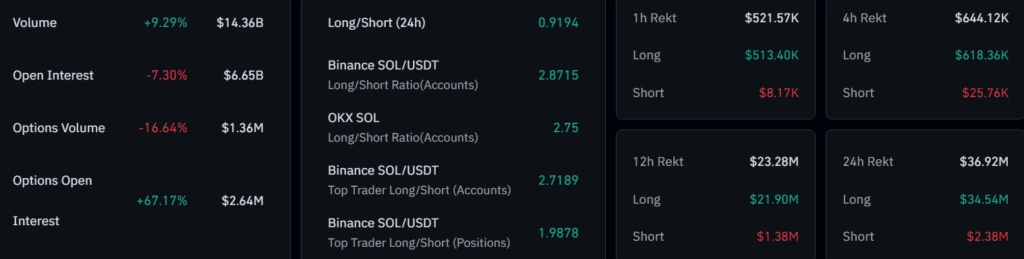
SOL Liquidations
Source: CoinGlass
However, this also brings a note of caution. While the surge in liquidations supports bullish momentum in the short term, an overcrowding of long positions could spark a price correction if sentiment suddenly shifts.
Despite these bullish signals, Solana’s technical indicators paint a mixed picture.
If SOL fails to hold the $140 support, analysts warn that it could revisit $105, marking a potential retest of its yearly low.
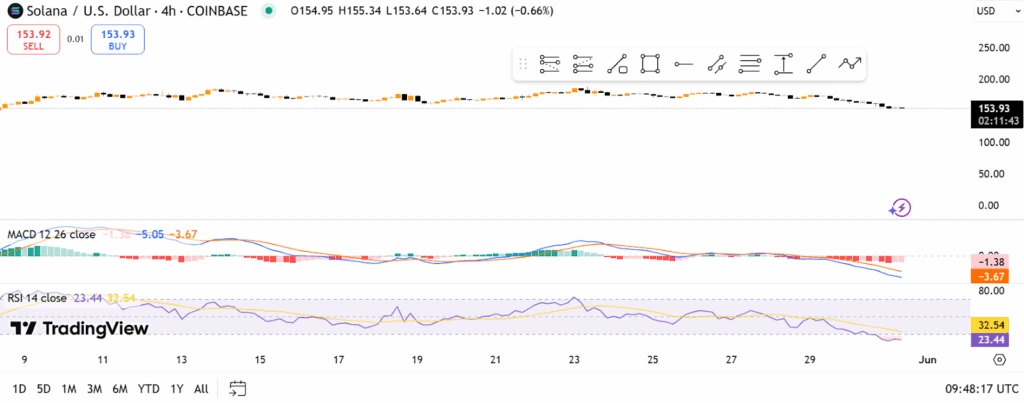
SOL/USD
Source: TradingView
That said, the RSI had recently spiked above 70 before retreating, a sign that the asset might be undergoing healthy consolidation rather than a full reversal. If momentum picks up again, especially with support from volume, the path toward $160 remains open.
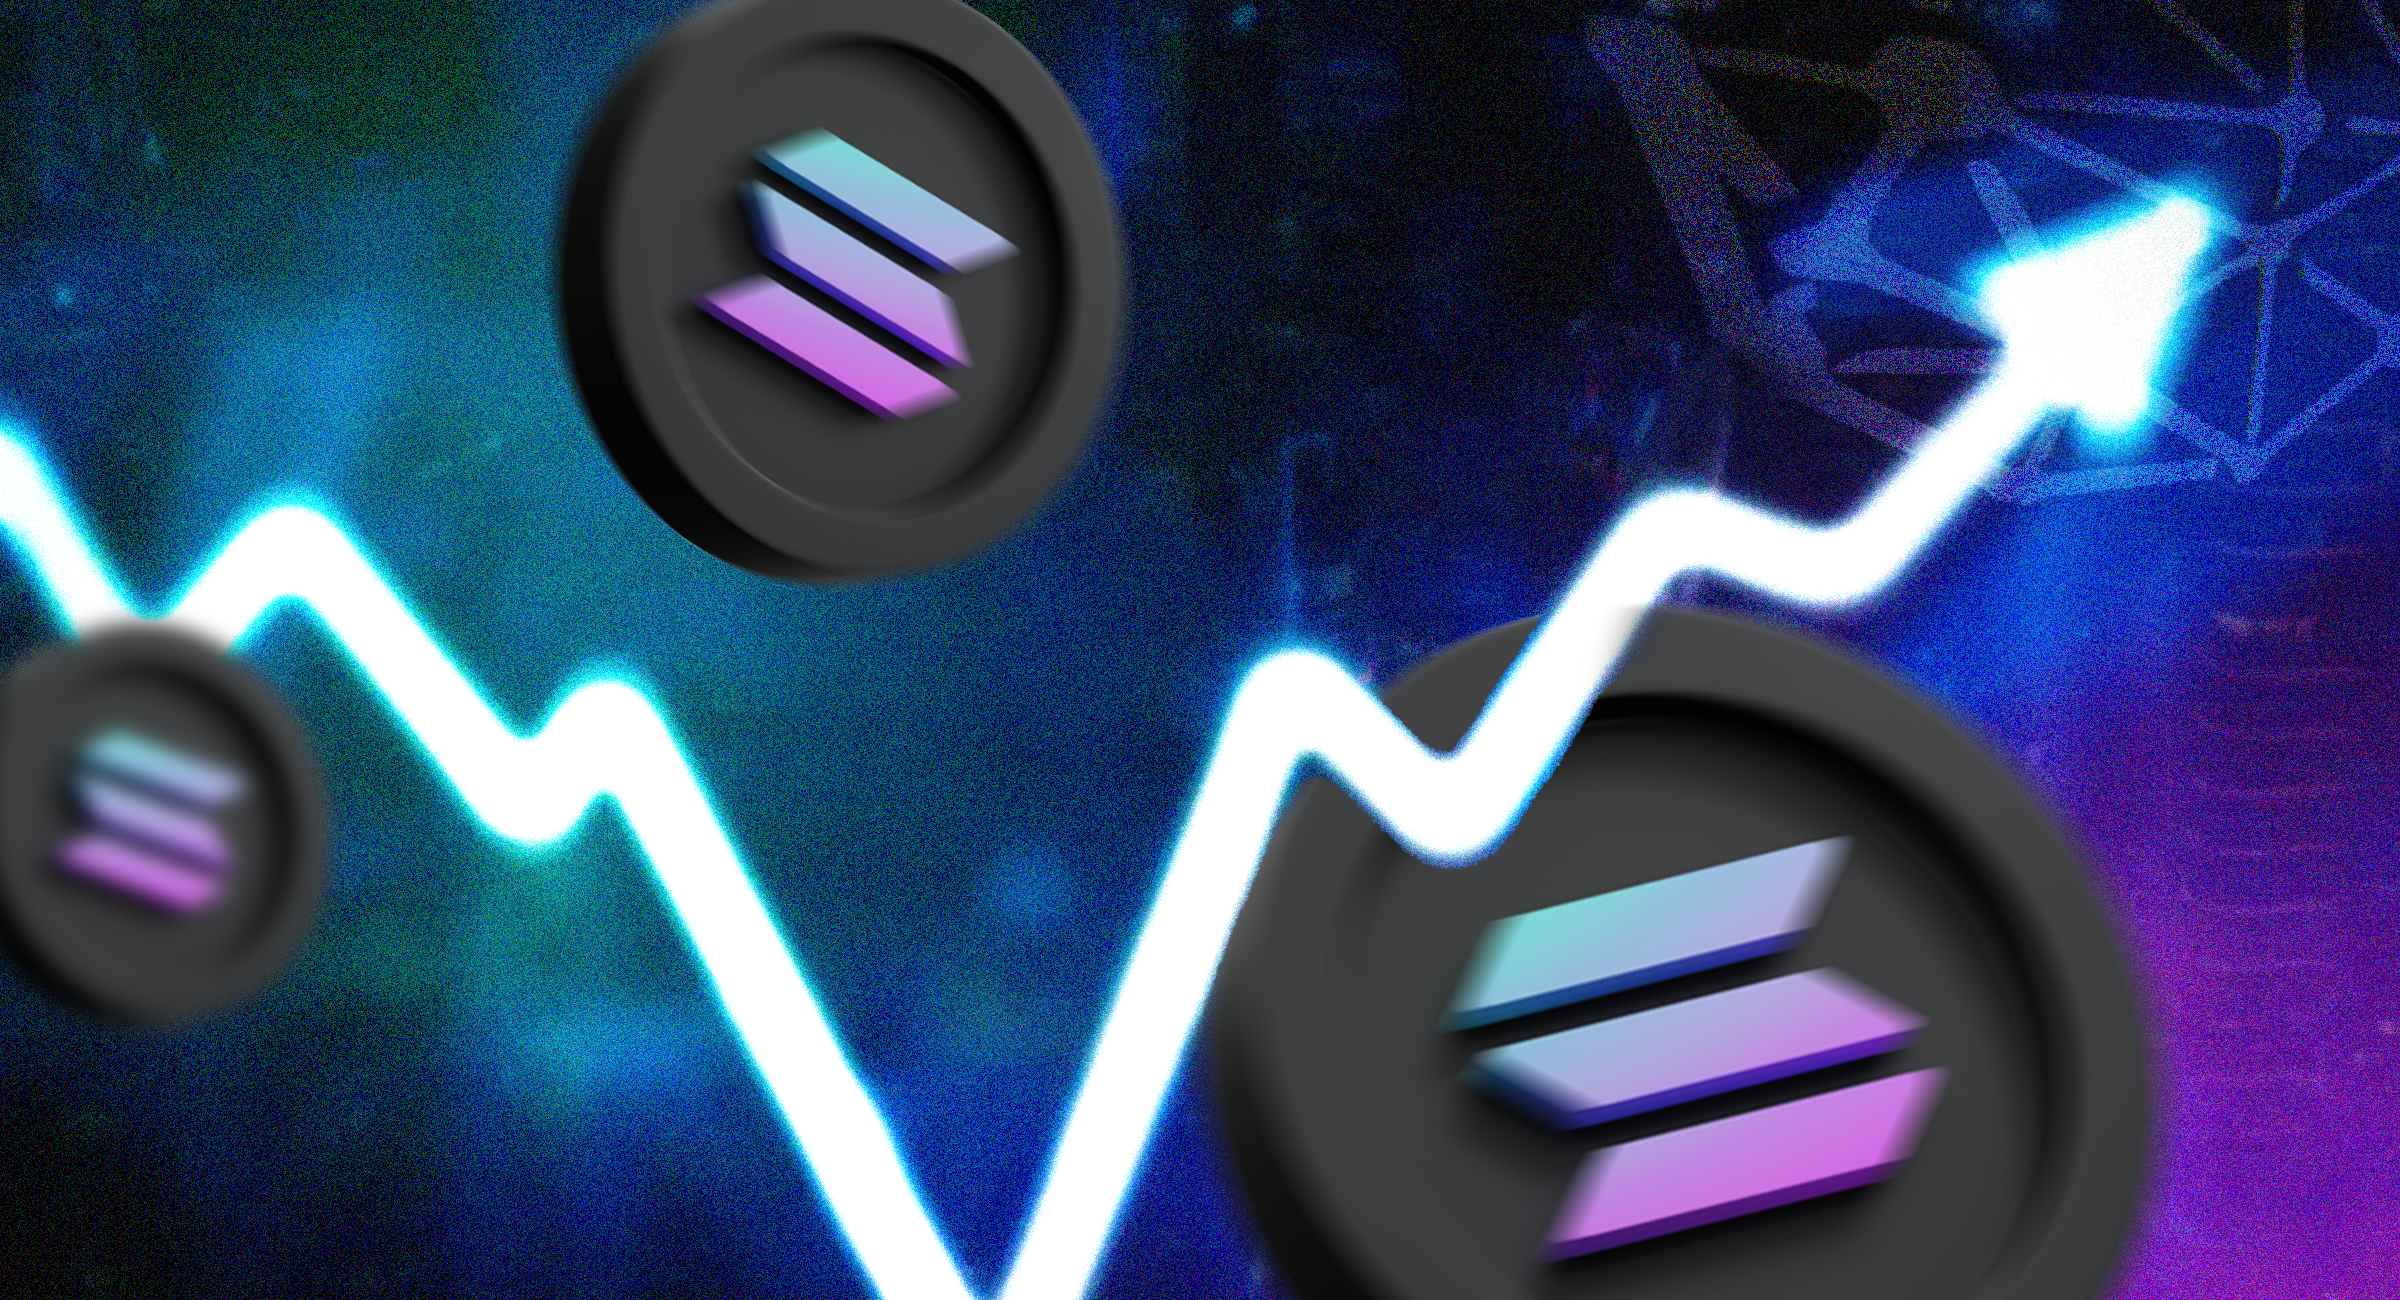
Solana Summer Crypto Exploration refers to the renewed interest and trading activity surrounding Solana during the summer months, fueled by price movements, technical signals, and broader market participation.
The TD Sequential indicator is widely used by traders to identify potential market reversals. In Solana’s case, the recent buy signal may indicate that bearish momentum is fading, but it should be confirmed with volume and price action above $150.
A breakout above $150 could signify a shift in market sentiment. If confirmed by strong volume, it may pave the way for a rally toward $160 or higher, making it a key level to watch during this Solana summer rally.
Yes. While short liquidations can push the price higher, excessive long positioning following the squeeze can lead to sharp corrections. It’s crucial to monitor market sentiment and volume trends.
If Solana fails to hold the $140 support, it could continue to slide toward $105, which is its lowest closing level this year. Bearish technical indicators like the MACD and RSI are key tools to watch in this scenario.