
The ETH/BTC ratio remains under 0.05, showing Ethereum’s relative underperformance.
Despite institutional adoption and an all-time high ETH price, the ratio hasn’t recovered meaningfully.
Historical data shows ETH has outperformed BTC in only 15% of trading days since 2015.
Experts suggest Ethereum may need more time to regain strength relative to Bitcoin.
Despite Ethereum’s impressive price rally, hitting an all-time high of $4,957 on August 24th, the ETH/BTC ratio has stayed below the critical 0.05 threshold.
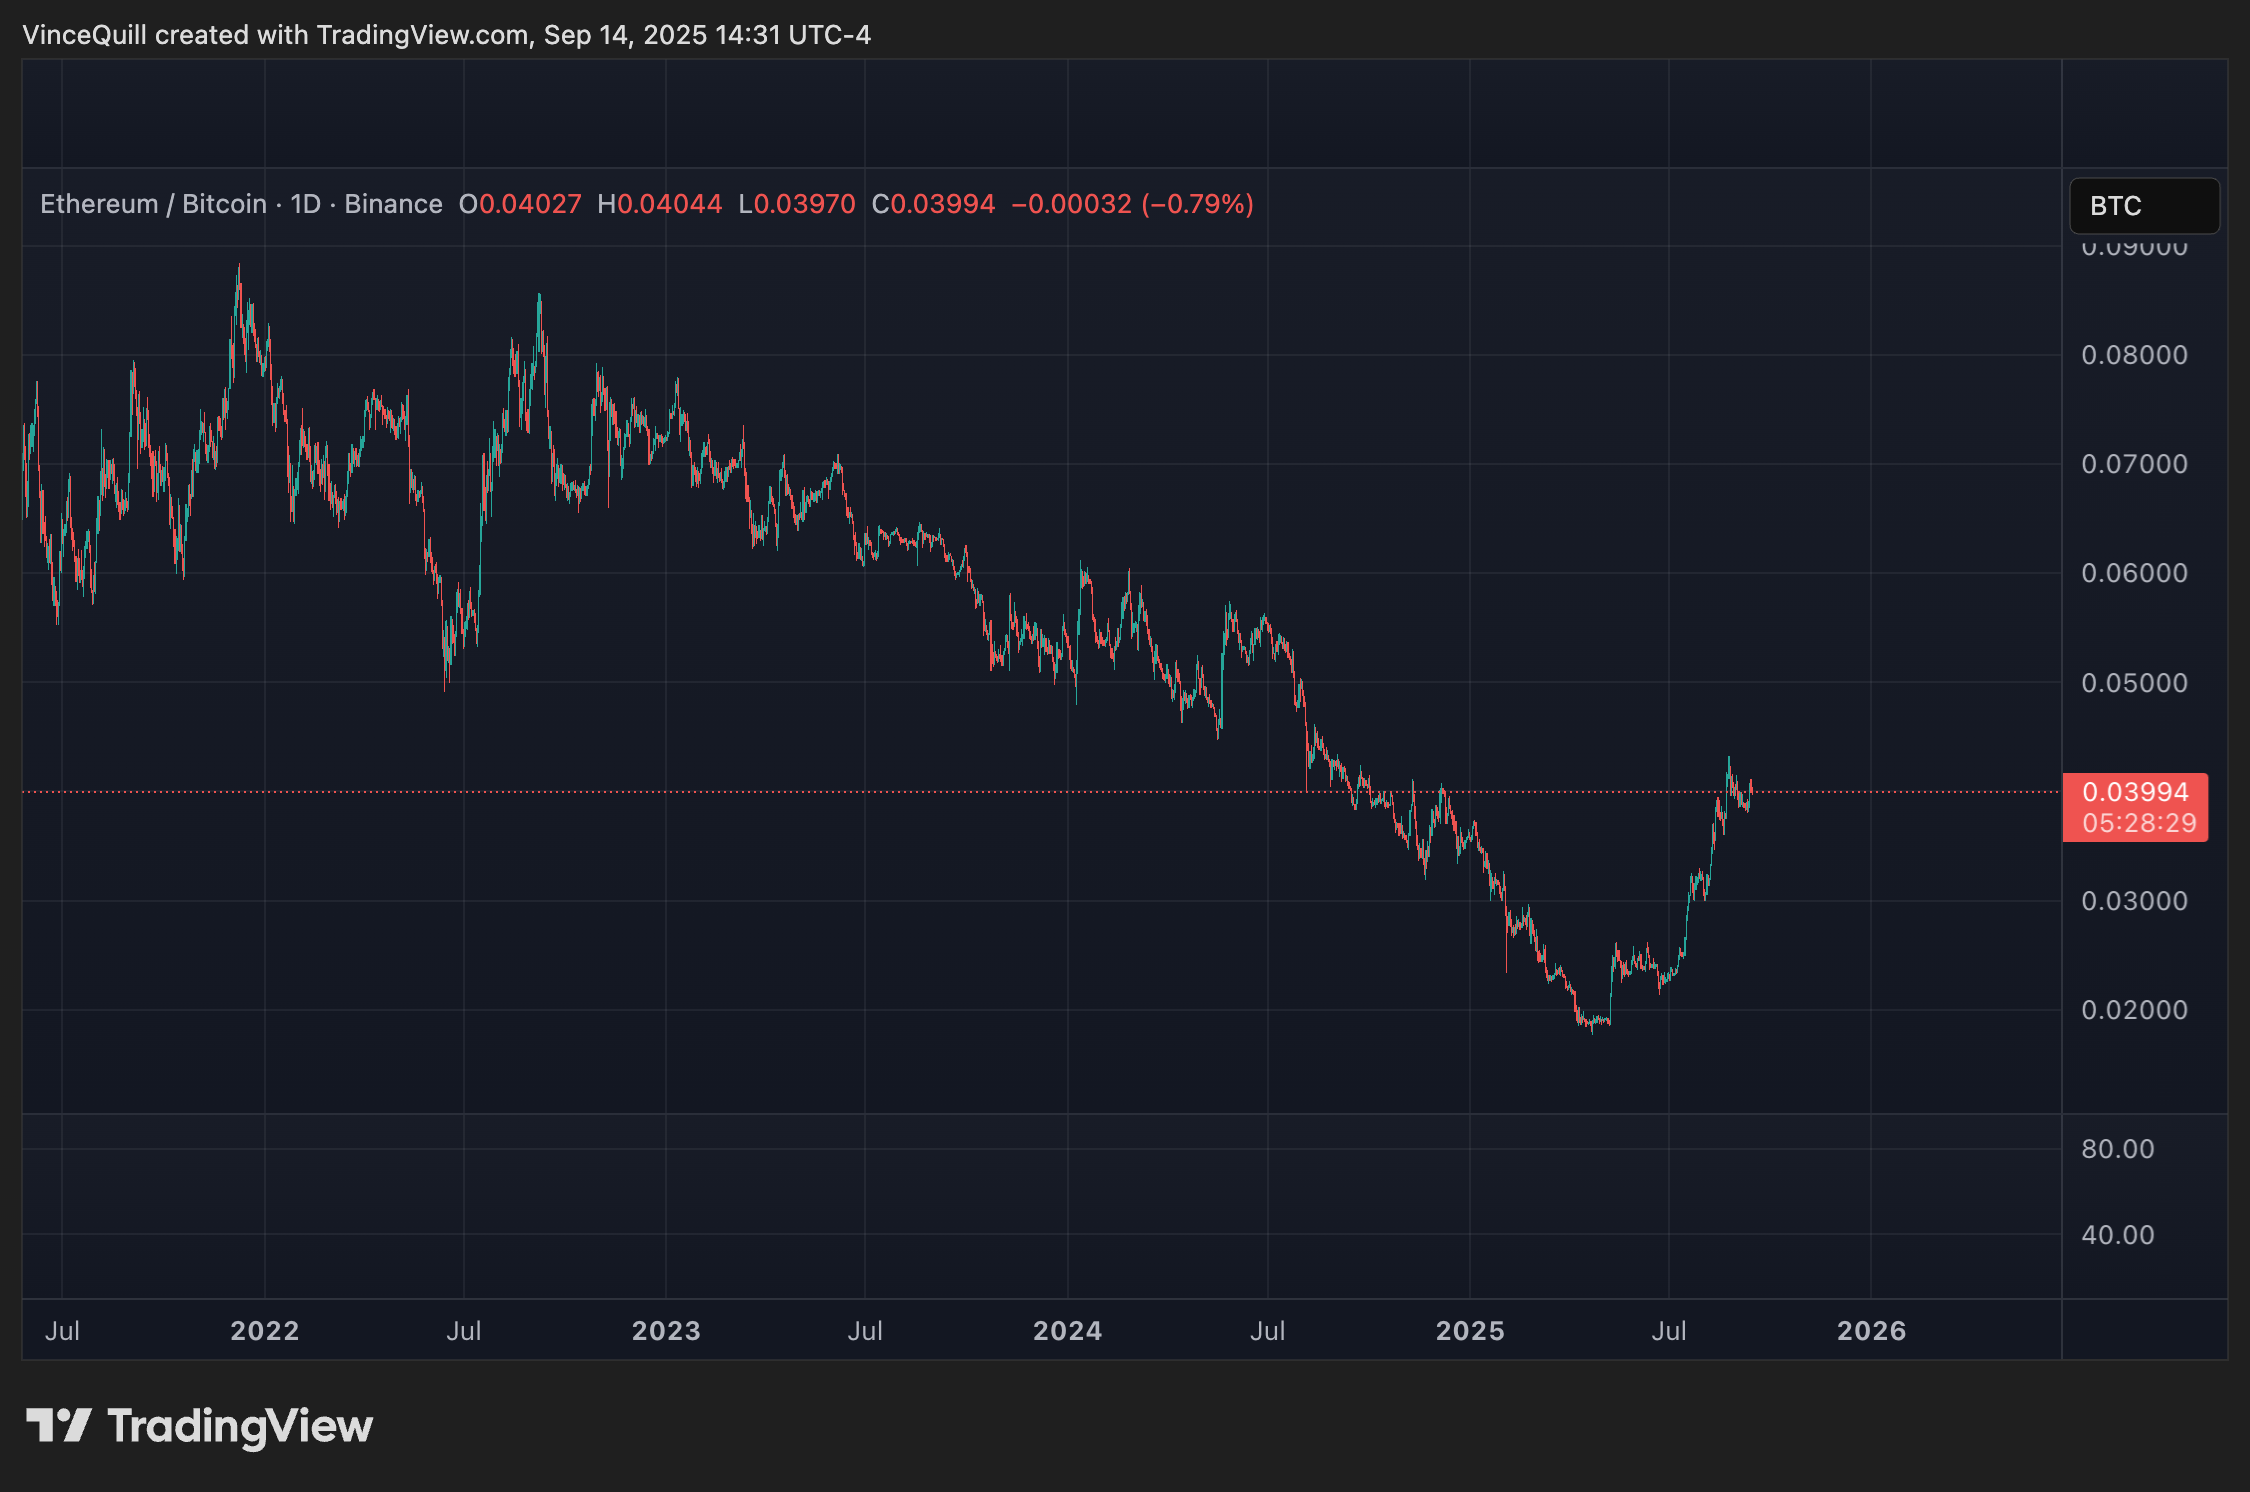
The ETH/BTC Ratio Between July 2022 To July 2025
Source: TradingView
According to data from CoinGecko, the ratio peaked at 0.14 in June 2017. However, it has failed to revisit even half of that level in recent years.
In recent months, Ethereum has gained traction among institutional players:
Major banks and hedge funds have started holding ETH in treasury reserves.
ETH spot ETFs have been launched across several markets.
The Ethereum Foundation has increased outreach to traditional finance (TradFi) players.
Yet, the ETH/BTC ratio remains unimpressed. Blockchain analyst Carla Mendes from ChainFlow Research noted:
“The ETH price has surged more than 150% since July, but its strength relative to Bitcoin is still lacking.”
Ethereum’s price surge during July and August 2025 is attributed to a series of bullish catalysts:
Launch of ETH ETFs in the U.S. and Europe
Ethereum 2.0 upgrades, including increased scalability and reduced gas fees
Growing adoption of ETH for DeFi and Web3 infrastructure
Increased developer activity and ecosystem funding
Despite these bullish fundamentals, the ETH/BTC ratio dropped from 0.04 in August to 0.039, illustrating Bitcoin’s continued dominance.
While Ethereum has had breakout moments, data shows it rarely outpaces Bitcoin over long periods.
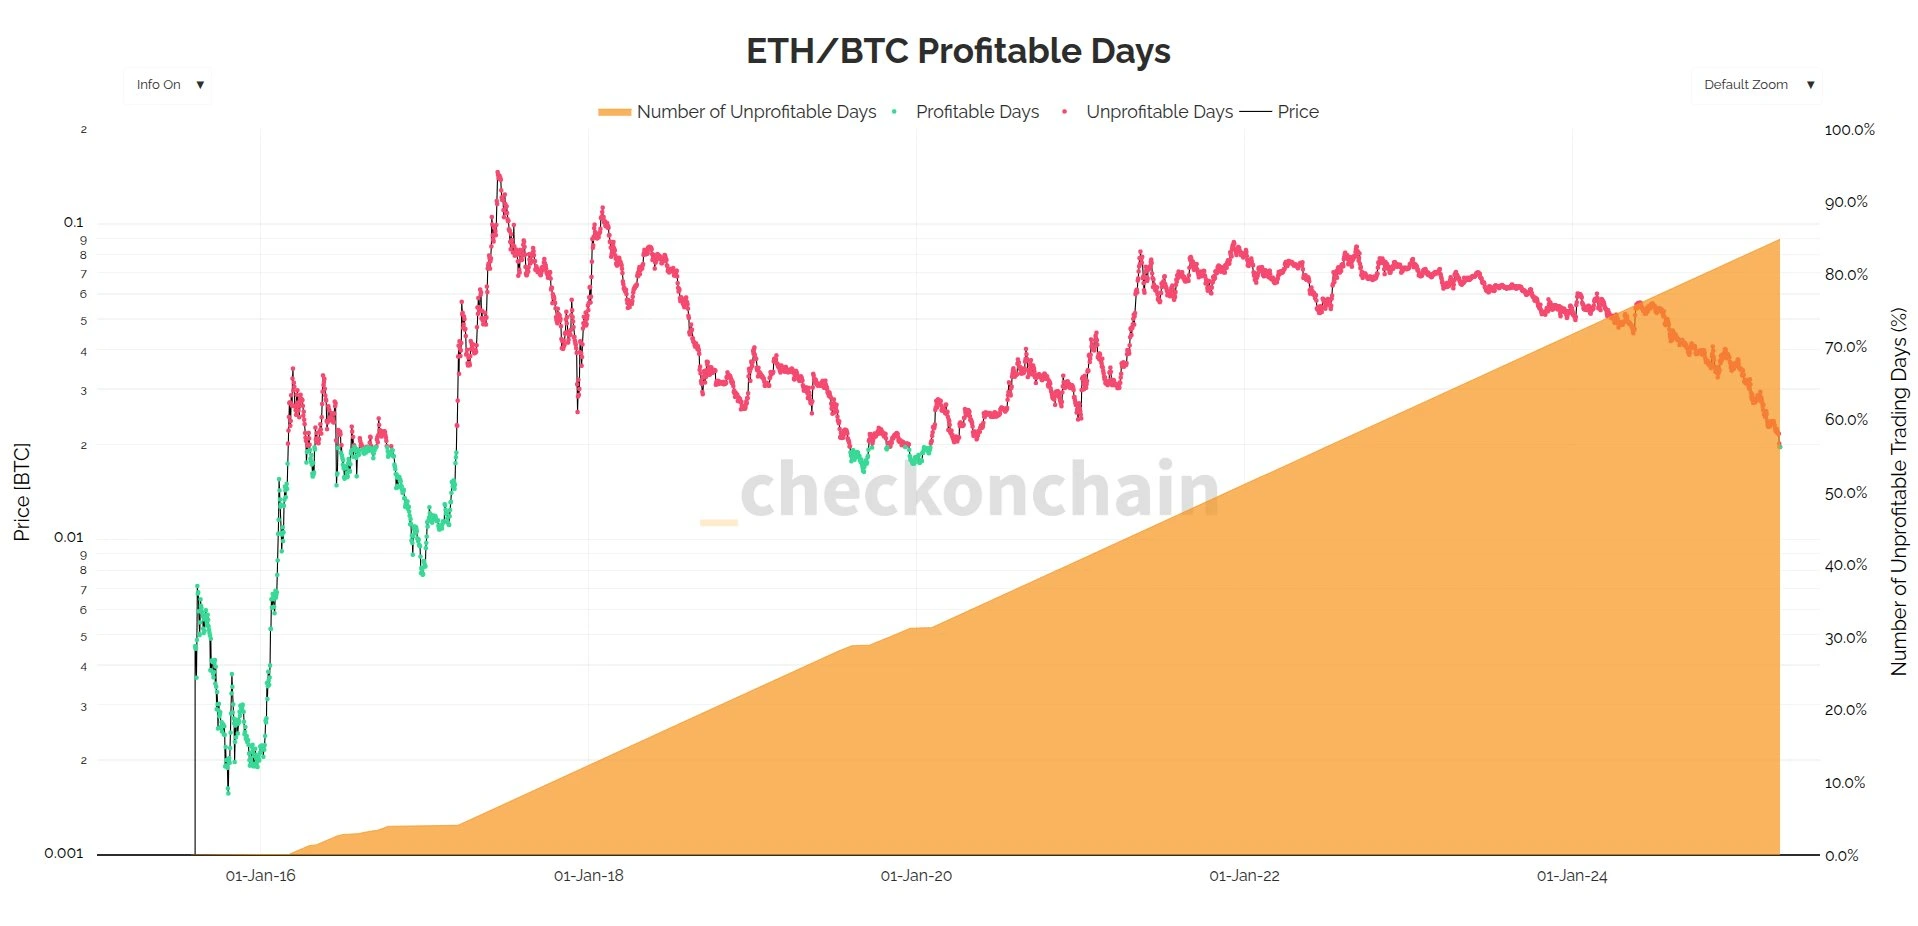
ETH & BTC’s Price Performance Comparison Since 2015
Source: Checkmate
According to crypto market analyst James Check (aka Checkmate), Ethereum has outperformed Bitcoin in only 15% of all trading days since ETH’s launch in 2015.
Most of ETH’s relative strength came between 2015 and 2017, a period marked by:
The launch of Ethereum
The 2017 crypto boom period
Since 2020, Bitcoin has regained the upper hand, maintaining a stronger performance on a macro scale. ETH rallies have become more isolated and often fail to sustain strength against BTC.
As Ethereum approaches the psychological $5,000 mark, analysts suggest a cooling-off period is likely. The rapid climb during the summer months may lead to short-term consolidation, which could suppress ETH’s relative gains further.
Jake Kennis, an analyst at blockchain research firm Nansen, said:
“With ETH hovering near its previous ATH, it may take weeks or even months to break out again.”
Unless Bitcoin enters a period of stagnation or Ethereum introduces a major differentiator, the ETH/BTC ratio may remain under pressure.
The ETH/BTC ratio shows how much one Ether is worth in terms of Bitcoin. It’s a commonly used metric to compare their relative strength and momentum.
The ratio gives insights into which asset, ETH or BTC, is outperforming. It helps traders decide where to allocate capital during bull or bear markets.
Yes. A rising ETH/BTC ratio typically indicates that Ethereum is gaining strength versus Bitcoin, often signaling growing interest or utility in the Ethereum ecosystem.
Bitcoin has also rallied significantly. ETH’s gains, while impressive in dollar terms, have not kept pace with BTC on a relative basis, keeping the ETH/BTC ratio suppressed.