Possible Bullish Double Bottom Forming
Technical analysts are spotting a “double bottom” pattern on SHIB’s daily chart, which often signals a bullish trend.
Source: CoinMarketCap
This occurs when an asset tests a low point, bounces, and retests it, with the support level around $0.00001154. If SHIB breaks above the interim peak, a price surge could follow.
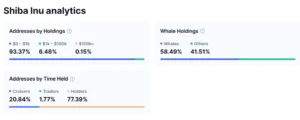
Community Sentiment Strong Despite Whale Control
While whales hold 58.5% of SHIB’s supply, over 77% of wallets are long-term holders, suggesting strong community belief in the token.
Although the chart and whale activity point to a potential move, analysts warn that technical patterns can fail, and whale movements may be unclear.
Subscribe to stay informed and receive latest updates on the latest happenings in the crypto world!

Content Strategist
Subscribe to stay informed and receive latest updates on the latest happenings in the crypto world!
 Figure Heloc(FIGR_HELOC)$1.032.90%
 Hyperliquid(HYPE)$59.422.60%
 USDS(USDS)$1.000.00%
 Canton(CC)$0.1233233.00%
 Ethena USDe(USDE)$1.000.00%
 Global Dollar(USDG)$1.000.00%
 Circle USYC(USYC)$1.130.00%
 BlackRock USD Institutional Digital Liquidity Fund(BUIDL)$1.000.00%
 Ondo US Dollar Yield(USDY)$1.140.10%
 Ondo(ONDO)$0.4034733.60%
 Bittensor(TAO)$198.013.80%
 World Liberty Financial(WLFI)$0.055004-2.70%
 Aster(ASTER)$0.630.10%
 MemeCore(M)$1.245.30%
 HTX DAO(HTX)$0.0000020.20%
 Ripple USD(RLUSD)$1.000.00%